""

SAP Strategy Management: When the Customization Generates New Standards

During the time we spent at our customer in Abu Dhabi, we learned a lot about the SSM customization until we realized that the final product could be a new standard instead of a customization. Our customer had some concerns about the out-of-the-box features and they were asking us to modify the functionality by adding new ones and automating the entire platform.

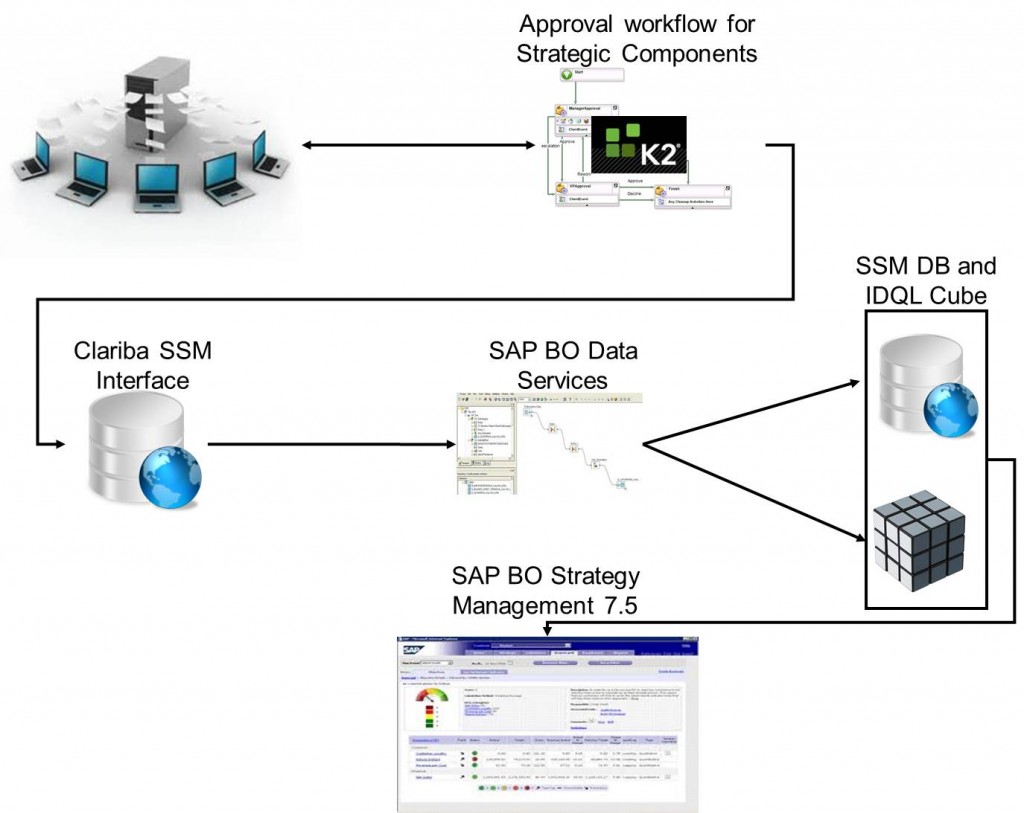
The biggest challenge we had was related to the approval work flow. How can the customer approve the creation of a new Strategic Objective? SSM does not allow the user to perform this task and our customer raised this topic as a risk. The work flow for the strategic components became a requirement from that moment. They asked us to use K2 black pearl, which for us was like a black box. We decided then to merge our teams and split the work in order to achieve the same goal.

We created a simplified SSM data model that reduced the number of tables needed to create a Balanced Scorecard and we connected it to SSM. From our interface we were able to populate any strategic components as well as the cube (using IDQL commands). We then created the database and a dedicated ETL (with SAP BO Data Services) that was populating the balanced scorecards.

On the other side of the desk, our customer was building the work flow in K2, creating the new web pages that are now replacing the SSM administration tool and connecting the output directly to our interface tables.

It took us a while before we got a chance to see something that was really working, but we did it; we built a powerful interface that creates balanced scorecards within SAP SSM.

In this interface everything runs automatically, the KPIs as well as the perspectives, the objectives, the initiatives and also the milestones are being updated by a scheduled ETL job in SAP BusinessObjects Data Services.

The customization we made can be summarized as follows:

  • Normalization and re-engineering of SSM tables (after performing a specific analysis on SSM data model) to create our interface DB.
  • Connection of our interface tables to the SSM tables.
  • Customization of the standard IDQL jobs that are updating the SSM Cubes.
  • Making SSM read-only to avoid changes on initiatives or milestones from the end user interface.
  • Making the SSM interface tables available for reporting and dashboarding as they can be included in a simple universe.

So far the only manual intervention that the customer needs to do is create the strategy maps. This step needs to be done from the SSM administration tool.


To conclude, the solution we explained above has been created as a customization but it can be adapted for any customer that might need this level of security and detail for their SSM implementation.

Part of this implementation could be applied for the companies that need to have an automated KPIs basket that does not includes any manual entry for the values (the final part of this solution can be considered as an SSM DB connector). This solution has been developed by using SQL Server 2008 but it can be connected to any data sources (i.e. SAP R/3, ORACLE DB, flat files, etc.).

If you think that this solution might work also for your company or your customers please feel free to contact us by email at info@clariba.com or by leaving a comment below.

How to move content in BusinessObjects BI 4.0 with version control using LCM

In SAP BusinessObjects BI4, SAP provides us with an enhanced LifeCycle Management (LCM) application to deploy content.  This version has new features useful for moving our files between servers or directly between BusinessObjects XI repositories. The enhancements include aspects like security, the capacity to recover different document versions, the ability to safeguard information and provide internal control about what changes are made and who has made them.

It is also important to note that with the release of BI4, the Import Wizard (the tool used up to this release) is no longer working for deploying content between two BI4 servers; it only works to upgrade from a previous release.

One of the most important new features of LifeCycle Management is that you can import categories as well as other types of objects such as: Information Designer, Pioneer, Crystal Reports (next generation), Events and Xcelcius Enterprise.

Another improvement is the new exportable file version: LCMBIAR, which contains an enhanced file structure adapted to these new features. The Job component allows us to define a set of objects to transfer in LCMBIAR format. We can group these Jobs in folders to keep content organized into departments. However if the two servers are in the same network, the files  can also be migrated directly from one platform to another.

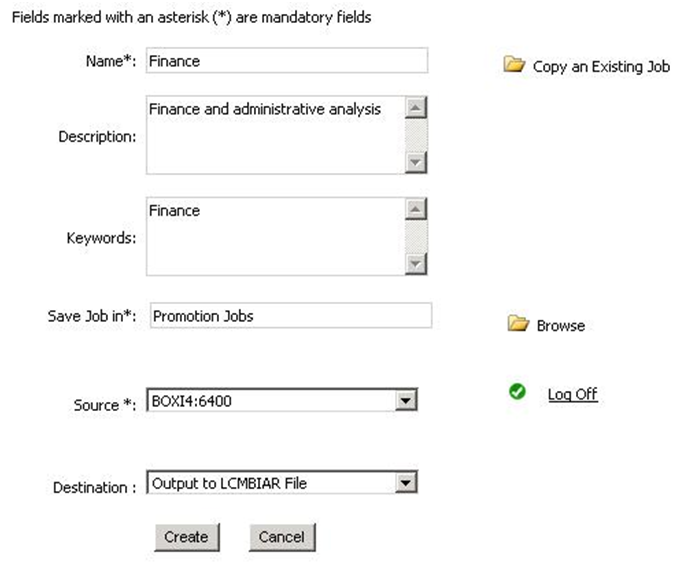
To create a new Job you will need to define: name, folder, origin and destination. Optionally but recommended you can add description and keyword.

LCM Menu
LCM Menu

In the Job you can select the objects that will be included in the LCMBIAR files, then click on ‘Manage dependencies’ to add items related to the objects selected before. Finally, you need to click ‘Promote’ to configure the Job settings.

Promote Panel

In the Promote panel we can find four options:

  • Summary: Check source and destination names to ensure the file is moving from the right source to the correct destination, change management ID.
  • Security Settings: Check this option when you want to release the security of the files.
  • Test Promote: Use this option to ensure that there will not be errors during the conversion.
  • Schedule Job: This is to plan the promotion task for later, very useful if you are not available to do it manually, typically at out of office times.

Rollback

The new feature Rollback deserves a special mention. It allows us to check the different versions of a conversion set and, in case of errors, to revert back to a previous stable version and therefore prevent any risk to the project.

Before starting a Rollback, you must ensure that the status of the job is one of the following:

  • Success
  • Failure
  • Partial success

The Job status refers to the current version in the system.

You can access the Job History from the home page after login to LCM. The Job History shows the list of all the previous versions of the selected Job. Please note that you only can go back to the most recent previous instance.

To restore the latest instance, click in the check box and then press Rollback button.

You can choose between two rollback options:

  • Complete Rollback: this will restore the destination system to its previous state before the job was promoted
  • Partial Rollback: enables you to roll back a set of infoobjects included in a job by selecting them from their objects list.

In summary, the handy Rollback function sets the latest instance as the current system version and enables the previous instance for rollback if required.

Conclusion

To summarize, the enhanced LifeCycle Management application is the best option to release your documents from development to production in SAP BusinessObjects BI 4.0. If you have questions about this method, or if you want to share your experience or tips, please feel free to leave a comment!

ictQatar and SAP partner to bring in innovative IT solutions to region

A collaboration between Supreme Council of Information and Communication Technology (ictQatar) and German IT giant SAP will make Qatar at par with more technologically advanced countries on bringing innovative IT solutions to the private and government sectors. Top officials from SAP and ictQatar separately outlined these programmes yesterday during the opening of SAP World Tour 2011 in Doha held at Sheraton Doha Hotel which was attended by some 300 participants from local business and government sector as well as SAP community partners.

Join Clariba at the SAP World Tour events in Doha on October 18 and Abu Dhabi on October 19

Clariba is pleased to be sponsoring SAP World Tour in Qatar and Abu Dhabi, the SAP business and technology event for C-level executives, IT decision makers, and Business managers. Join us at this showcase event for 2011 for an unparalleled opportunity to explore the entire SAP ecosystem under one roof and take away new vision and value for your business. In an increasingly consumer-driven world of accelerated pace where the rate of information continues to explode, businesses must get closer to their customer's customer. Join SAP co-CEO and Executive Board member Bill McDermott to find out how SAP helps leading edge companies digitize their business end-to-end and connect the boardroom to the front line worker and beyond. This is a new era of IT with innovations like mobile, in-memory and cloud computing that help businesses realize the full power of the integrated enterprise. Find out how you can take the next step forward to make your company a best run business.

“Clariba is proud to be sponsoring the SAP World Tour events in Qatar and Abu Dhabi, explains Marc Haberland, Managing Director of Clariba. “This is a premier SAP event and an excellent opportunity for business and IT professionals to discover more about SAP BusinessObjects BI4 and HANA, the latest innovations for business intelligence, while also experiencing BI solutions in action at our booth in the Partner Exhibition zone.”

The SAP World Tour  Qatar will be held on October 18 in the Al Majlis Auditorium, Sheraton Doha Resort & Convention Hotel, Doha, Qatar from 9:00 a.m. to 5:00 p.m. Attendance at the SAP World Tour is free of charge. Register now to secure your place.

The SAP World Tour Abu Dhabi will be held on October 19 in Hall 2, Abu Dhabi National Exhibition Center, Abu Dhabi, UAE from 9:00 a.m. to 5:00 p.m. Attendance at the SAP World Tour is free of charge. Register now to secure your place.

Highlights of World Tour 2011 include:

  • Gain inspiration from keynotes and informative breakout sessions that will focus on how new technology provides a path to business innovation and showcase the latest innovation in areas like mobility, in-memory computing, and business analytics.
  • Hear about the experiences of SAP customers - from small, medium and large companies - who have been able to accelerate innovation and minimize risk by implementing and adapting solutions faster
  • Get an in-depth look at future SAP applications that will support your growth strategies in areas such as Finance, CRM, Supply Chain and Procurement
  • Visit the comprehensive Exhibition Showcase where Clariba will be demonstrating exciting new solutions for organizations of all sizes
  • Learn how to maximize and future-proof your investment in mobility solutions to securely deliver information anytime, anywhere.

Don’t miss this unique opportunity to see how your investment in technology can deliver greater visibility for improved decision-making, operational excellence, flexibility and sustained growth - whatever the future might bring.

Dynamic Scale in WebI for Combined Graphs

The scale in graphs for WebI is something that can be left as automatic or it can be hardcoded by introducing figures. However it is always preferable to select the automatic set up for the following two reasons: firstly because when a new value is added to the graph, it won’t  out of scale, and secondly if the graph is located inside a section, the user will always enjoy the optimal graph size. But automatic scale has an issue when dealing with combined graphs. For example, if what we want to compare from the Y and Z Axis needs to be in the same scale, WebI creates two different scales. To help you with this challenge, this article will show you a workaround so you can have identical scales for all graph Axes, preserving the native dynamic feature of the scale.

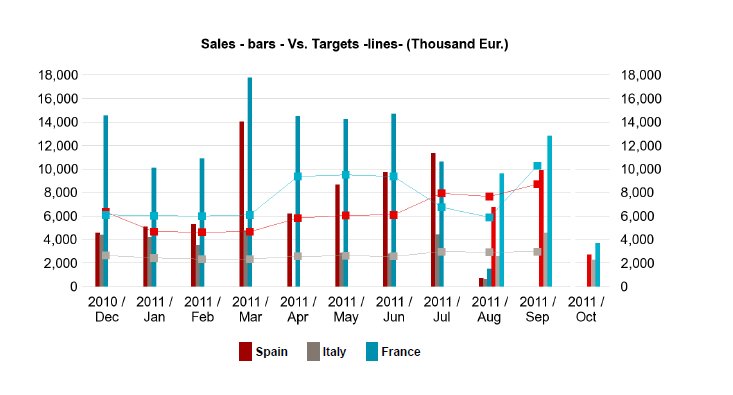
The Workaround Let's imagine the example of a combined graph with bars and lines. And imagine that your sales department wants to see the sales in bars and the target in lines, in a monthly evolution. The chance that the bars and lines will have the same scale is low, because targets normally are higher than the sales. As a result users cannot compare both pieces of information, even if they are shown in the same units.

A workaround to get to see target and sales in the same scale is the following:

  1. Create a measure with the highest value by month of the sales
  2. Create a measure with the highest value by month of the targets
  3. Calculate the maximum value between the two of them
  4. Allocate this dummy value in the last month shown of the graph and store it in a new measure
  5. Drag & Drop this last measure in both Axis (Y and Z) and paint the result in the same color as the background, so it is not seen

The Result

The graph will have the following look & feel:

Fig.1. The same optimized scale for both Y and Z axes also applies with Sections

Notice that if we decide to go for grid lines, these ones will have a small defect when it comes to the place where the dummy bar is shown. This is a small price you have to pay for the great functionality achieved, but remove the grid if you prefer and the result will be absolutely professional.

Conclusion This workaround adds value to the user who is looking for two measures being compared graphically and wants to always have the optimal data size automatically. If you have questions about this method, or if you want to share your experience or tips, please feel free to leave a comment!

Le Invitamos A Registrarse En Nuestro Webinar "Control Del Tráfico De Llamadas De Clariba" El Próximo 4 Octubre

SAP y Clariba les invitan a asistir a nuestro Webinar "Control del Tráfico de Llamadas de Clariba" el próximo 4 de Octubre 2011, de 10:30 a 11:30 para conocer más sobre los beneficios de implementar una solución de atención al cliente de tiempo real. Su Centro de Llamadas y de Atención al Cliente juega un papel importante en el proceso de venta e influye directamente en la experiencia del cliente. Cuando nos encontramos en un pico de llamadas, aumenta el tiempo de espera, los clientes están insatisfechos con su experiencia y los directores de equipo necesitan poder reasignar dinámicamente los agentes para cumplir con los cambios de carga de llamadas. Los directores también necesitan encontrar la raíz del problema en cualquier ineficiencia para marcar el camino adecuado, como la formación del personal o la gestión del cambio.

Nos complace invitarle a nuestro Webinar con la siguiente Agenda:

  1. Bienvenida y Introducción
  2. Caso de Éxito: Departamento de Atención al Cliente para un gran cliente de Telecomunicaciones
  3. Demo del Control de Tráfico de Llamadas de Clariba: Beneficios y Funcionalidades
  4. Herramientas e implementación de SAP BusinessObjects
  5. Preguntas

Altamente Visual y Fácil de Leer: Control de Tráfico de Llamadas de Clariba es fiable, actúa en tiempo real y es la solución más atractiva que permite a los centros de llamadas y atención al cliente mostrar de forma autónoma los parámetros clave del tráfico de llamadas, las alertas de servicio y las tendencias de hasta 5 equipos simultáneamente en una única pantalla. Esto a su vez se puede mostrar en una gran variedad de dispositivos, desde las pantallas de gran formato en su oficina a los dispositivos móviles.

Datos Fiables en Tiempo Real: La solución de control de tráfico está basada en el conjunto totalmente integrado de tecnología BI SAP BusinessObjects y está totalmente automatizada, reduciendo así la dependencia del proceso manual de carga de información actualizándose en cada instante, proporcionando información fiable y actualizada para la toma rápida de decisiones.  SAP y Clariba le invitan a registrarse en el Webinar de Control de Tráfico de Llamadas para conocer más sobre los beneficios de implementar una solución de atención al cliente de tiempo real.

Para registrarse al Webinar “Control del Tráfico de Llamadas”, este 4 Octubre 2011, a las 10:30 haga clic aquí.

Para más información acerca de nuestras soluciones SAP BusinessObjects para departamentos de atención al cliente envíanos un email a través de events@clariba.com o llamándonos al +34 930 008 778.

SAP and Clariba invite you to attend our Webinar "Clariba Real Time Traffic Control" on this October 4th 2011, from 10:30 to 11:30 to learn more about the benefits of implementing a real-time, customer service solution.

Call Centers and Customer Service Departments play an important role in the sales process and are influential in shaping the customer experience. When call volumes spike, wait times increase or customers become dissatisfied with their experience, team managers need a way to dynamically reassign agents to meet changing call loads and management needs a way to drill down to the root cause of any inefficiency to find the appropriate course of action, such as retraining or process changes.

 The Traffic Control webinar agenda includes:

  1. Welcome and Introduction
  2. Case study: Call Center Department for prominent Telco customer
  3. Demo: Traffic Control Benefits and Features
  4. SAP BusinessObjects tools and implementation
  5. Q&A

Highly Visual and Easy-to-Read: Clariba Traffic Control is a reliable, real-time and eye-catching solution which allows Call Centers and Customer Service Departments to autonomously display key call traffic metrics, service level alerts and running trends for up to 5 teams simultaneously on a single dashboard. This in turn can be displayed on a variety of devices, from large screens throughout the office to hand-held mobile devices.

Real Time and Reliable Data: The Traffic Control solution is based on the most integrated stack of SAP BusinessObjects technology. It is fully automated, reducing reliance on manual reporting processes and is refreshed each minute, providing reliable and current data for quick decision making.

To register for our Webinar "Clariba Real Time Traffic Control", this October 4th 2011, at 10:30 click here. 

For more information about our SAP BusinessObjects solutions for Contact Centers send an email at events@clariba.com or call us at +34 930 008 778.

Migration from Deski R2 to Webi R4 with FreeHand SQL

In this article I would like to write about our first migration from BOXIR2 to BOXIR4 in which we had to migrate the entire BO platform (Universes, Reports, Dashboards, Security...). This was quite a substantial migration. Most of the reports that we had to convert were Deskis. We used two applications in order to migrate these objects: Report Conversion Tool (RCT) used for converting reports from Deski to Webi and Upgrade Managment Tool (UMT) which instead is used for moving objects from different environments. This should be an automatic and simple process, but we had encountered some difficulties when migrating Deskis that had FreeHand SQL embedded.

So we would like to move on to explaining the two solutions we worked on that have lead to a successful conversion.

  • Direct conversion from R2:

First of all we should check the Deski connection; once we have detected all the properties of this connection we will have to recreate it in R4. It is important to be careful during this process because we also need to create the ODBC Data Sources in our system.

At this point we open Universe Design Tool and we replicate the connection in R4. We have to make sure we use the exact same name we had in R2. Also notice that we should select a shared connection.

Note: Once more we would like to stress the importance of using the identical name as well as the very same parameters of the R2 connection.

Now we have the same connection in both environments. So we can proceed with the report migration. Use RCT from R4 to convert the Deski.

Remember to select the checkbox Convert documents containing free-hand SQL/Stored Procedures. If not this process will not work.

Having completed this step the following objects will be created:

FreeHand SQL Universe: Where we can find the SQL from the Deski data source which is embedded in a derived table.

FreeHand SQL Universe Connection: Special connection for the FreeHand SQL Universe with the name and parameters that we had previously created.

The nomenclature of these objects is as follows:

Universe:  FHSQLXXX  ( You can find it in the Report Conversion Tool Universes Folder)

Universe Connection: FHSQLXXX_Connection_Name

If you don’t create the connection in the final environment, you will get this error message:

  • Conversion in R2 and move to R4:

This option is probably a bit more laborious than our previous solution nonetheless based on our experience you will come across less errors.

First of all convert the Deski to Webi in R2. Remember to select the FreeHand SQL conversion checkbox. The advantage is that we won’t need to create the connections because in actual fact we were converting the report in the same environment, so the connections are already defined.

Once we have executed the RCT we will have created the same objects as outline in our previous example.

Finally we should use the UMT to move the reports and its dependencies (Universe& Connection) from R2 to R4. So we only need to select the webi reports and tick the option “Convert selected object and its dependencies”.

In conclusion, thanks to our experience migrating all Deski reports from both environments, we firmly believe that the best practice in order to avoid connection problems is to convert Deskis in R2. From here we can move by using UMT the Webi, the FSQL Universe and the FSQL connection.

SAP Data Warehousing Solutions: an October 2011 Review

Regardless of software or hardware vendors, the Data Warehousing market is an area of growth, expected to increase about 10.1% in CAGR (compound annual growth rate) by 2015 according to the latest study carried out by IDC. SAP, thanks to the acquisition of Sybase, it is seen as a leader in the Data Warehouse by Gartner & Forrester. This article is focused on the solutions provided by SAP for organizations looking for enterprise-oriented data warehouses or more agile high-performance data foundations and to catch a glimpse of their future road map.

Enterprise Data Warehouse

  • SAP NetWeaver Business Warehouse (BW): is nowadays a very stable product, with a large installed base and in constant growth (more than 12000 customers, more than 15000 productive systems), and what more it has not been affected by the economic downturn in 2009. If we look at its future evolution, it is intended to be running on HANA in 2012 which will be used as the underlying In-Memory database Platform (BW 7.3x SP5), this means to be based on an  already built-in Business Warehouse Accelerator.

High Performance Analytic Data Foundation

  • SAP HANA: is a flexible, data source agnostic, in-memory appliance that analyzes high volumes of transactional data in real-time. It includes tools for data modeling, data and lifecycle management, security and operations. It combines SAP software components which are optimized with the hardware provided by partners. The benefits are the following: make smarter business decisions supported by an increased visibility  of very large volumes of business information, react to business events more quickly through real-time analysis and reporting of operational data, a new application foundation for a new category of applications, streamline IT landscapes and finally reducetotal cost of ownership (TCO). If we look further  ahead in time, there will be a transition going from having SAP Business Objects BI 4.0 running on SAP HANA 1.0 to having the whole SAP Business Suite running on SAP HANA 2.0 in 2013.


  • Sybase IQ: is a market leading, high-performance, columnar analytics server and data warehouse specifically designed for high speed data analytics, enabling high speed performance of complex queries against large datasets, with the advantage of being a low cost  maintenance when compared to row-based systems (by reducing the need for aggregates and indexes). It is a mature and proven solution with about 1900 customers and more than 3300 unique deployments. SAP will continue to support and invest on this acceleration technology, especially for non-SAP applications and data (including the possibility of placing SAP BusinessObjects BI on top).


  • SAP BusinessObjects RapidMarts are preconfigured jumpstart data marts that are designed to accelerate BI. And they all come pre-packaged by subject areas and sub-areas specific to SAP modules (Finance, Manufacturing, Operations, HR, etc.) as well as for non-SAP applications (JD Edwards, PeopleSoft, Lawson, Oracle EBS, etc.). The key elements included are the following:
  1. ETL Mappings: Source-to-target mappings and data transformation for relevant source tables (initial and incremental data movements).
  2. Data Marts: set of target RDBMS objects and schemas based on best practices for dimensional data modeling (Oracle, DB2, SQL Server, Teradata).
  3. BI Content: preconfigured universes based on best practices and samples of reports displaying  the wealth of data available.

If you need any further information on the solutions presented here, don’t hesitate to post a reply or contact Clariba.

SAP BusinessObjects Dashboards 4.0 Cookbook - Review

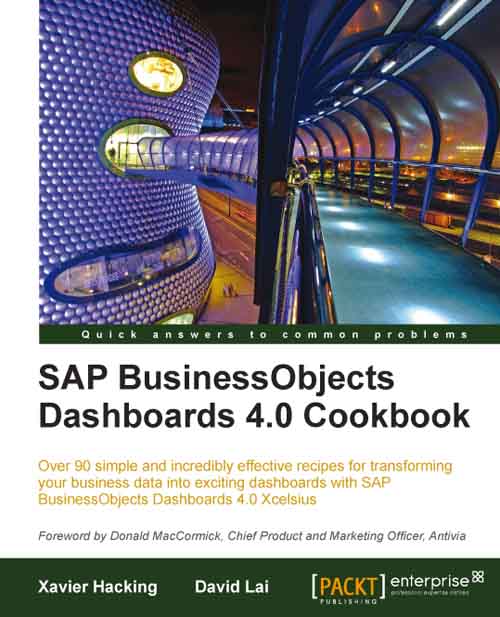
IntroductionSAP BusinessObjects Dashboards 4.0 Cookbook, by Xavier Hacking and David Lai (352 pages, May 2011) promises you nothing less than "Over 90 simple and incredibly effective recipes for transforming your business data into exciting dashboards". Does it achieve this objective? Read the full review below to find out.

While I have experience working with BO Xcelsius 2008 (what BO Dashboards would formerly go by), I didn't have any with BO Dashboards 4.0 before reading this book. So my expectations about it were simple: tell me how to do with BO Dashboards 4.0 what I already know how to do with Xcelsius; give me recipes around the new features, and show me a few extra tips. I can tell you right now: even though this book has not met all my expectations (as it's not focused on the new 4.0 version), it is a really good one.

The book is structured in ten chapters (see the table of contents) containing a dozen recipes each. The recipes follow a steady progression, from simple to advanced recipes. You can of course directly jump to any recipe, but reading the whole book in the proposed order is also a possibility.

SAP BusinessObjects Dashboards 4.0

The good and the bad

In a few key points I would like to offer my perspective on the strengths and weaknesses of this read, what I found to be particularly stimulating and enriching as well as on some aspects that I, as a reader, would've liked to see integrated.

What I like the most:

  • It feels like the recipes come from a real-life experience. Not only do the authors tell you how a component can be used, but they also tell you in which circumstances these are used at their best. The examples used by the authors make a lot of sense.

  • The recipes chosen cover a nice proportion of the BO Dashboards / Xcelsius universe. It is a very good base from which to start and move forward.

  • The first chapter is about best practices (color-code and comment the spreadsheet, etc.); strictly speaking not recipes but the fact remains that this is still a very good idea.

  • The chapter about add-ons shows in an easy way how to extend BO Dashboards.

  • The links to online resources are few but worth it (one of these is, for example, the very useful Business Objects Board).

  • The book is quite clear and well written. Examples are easy to follow thanks to full color illustrations.

What I don't like:

  • A few things aren’t outlined with enough precision and may need some time in research before executing.

  • The index is cluttered with many terms that I wouldn't describe as necessary (to take an example, all the supported Excel functions are listed, and I doubt that anyone will look for the entry entitled "dashboard" when that is what the whole book is about).

  • Some of the internet links given in the book cannot be reached as of today.

What I'm missing:

  • I would have enjoyed is a section about the differences between Xcelsius 2008 and Dashboards 4.0 with a list of recipes that are valid only on the latter. It would allow experienced users to focus on the new features only (rather than having to flick through all of the recipes). This is where the book tends to fall short, in my opinion.

  • For intermediate readers, a more complete real-life dashboard example could have been a great addition. The two case studies provided in the appendix A are good, but still pretty far from what I've been asked for in most client engagements.

A book for whom?

While many cookbooks require a good knowledge of the corresponding software/programming language, this is not the case here. The initial part of this book is targeted at beginners and no prior experience of BO Dashboards (or former Xcelsius versions) is required. Some general knowledge of Excel is required but some recipes deliver useful tips about it.

So if you're new to BO Dashboards; do you want to buy this book? Definitely. You will get much farther (and much more quickly) with this book than with only online tutorials and the official documentation. The recipes are really clear and can be used for real-life dashboards.

Note that it's also a perfect book for Xcelsius 2008 beginners – you'll be able to use more than 90% of the book's recipes, and many of the example files can be opened in it.

Do you have previous experience with Xcelsius? Although many of the recipes might probably not be that exciting to you, you're still likely to like some of the recipes. Having a look at the table of contents shall be enough to convince you to buy this book (or to leave it aside).

If you're expecting a book on BO Dashboards 4.0, bear in mind that only a few recipes are specific to this version.

Conclusion

Although the title is a slightly misleading, the SAP BusinessObjects Dashboards 4.0 Cookbook is a great book to help any dashboard developer to improve on his/her Dashboards 4.0 / Xcelsius knowledge. Don’t miss it!

Thanks a lot to Pakt Publishing for sending us an e-copy of the book for the review.

PS: note that I only had access to the e-book version, so I can't say anything about this full-of-paper book you'll buy in a bookshop.