
One of our customers came up with a challenge for us asking if it was possible to open a folder or category in InfoView through a URL. Doing some research we found that in BO3 there is no SAP official solution for this (SAP note 1390226), however we found some workarounds on how to accomplish it, but the real challenge was that none of these supported SingleSignOn, so every time the end user clicked on the URL before entering in InfoView the logon screen showed up.
Tips and tricks on HTLM5 Dashboard conversion for BI Mobile
Getting the most from your SAP Strategy Management 10.0
You have successfully implemented SAP Strategy Management (SSM) in your company and users are gradually becoming familiar with that new tool. What’s next? How do we motivate managers to adopt it and use it as a support to their decision making tasks? In this article I would like to share my thoughts about the following topics
Common SAP Dashboards (Xcelsius) bugs and how to solve them
This post is about SAP BusinessObjects Dashboards (formerly known as Xcelsius) and its intricate form of work. If you are an assiduous dashboard developer or just beginning to work with the tool, you will notice some bugs that interfere with your developing and slows you down. My main goal is to talk about the bugs or "misfortunes" that I have commonly faced in SAP BO Dashboards (Xcelsius) and the workarounds that I have found to save you some time when working with this tool. My second objective is to open a discussion where you can comment on other SAP Dashboards issues and solutions you found.
Dashboard integration in SAP Crystal Reports
In this blog article I would like to share with you how to embed a dashboard in a Crystal Report using flash variables. First of all let’s give a scenario that leads us to do that. In this case we wanted to create a dashboard for a SAP GRC module. The problem was that we could not connect to the system directly with SAP BusinessObjects Dashboards (Xcelsius for the most nostalgic ones). Apart from that, there is a good thing about having a dashboard embedded in Crystal, you will have a dashboard that can be refreshed from Crystal Reports without needing a previous authentication. You will also be able to save the “report” (you can show the dashboard) in PDF with saved data and the dashboard will be completely clickable and navigable.
Providing SSM data to SAP BusinessObjects reporting tools - Exhausting all scenarios
In the last two months I have been in a couple of customers who were interested in the integration of SAP Strategy Management 10.0 with SAP BusinessObjects BI Platform 4.0. In this post I would like to explain what that integration is about.
First of all, a brief introduction about the solution. The SAP Strategy Management (SSM) software allows aligning the Strategy Plan of the company and its key objectives and spread it across all the organization. It is an out of the box Enterprise Performance Management solution in which you can insert the most important KPIs of your company in Balanced Scorecards or Strategy Maps and control their performance in relation to the Strategy of the company. Within SSM you can also create initiatives to implement improvements or corrective actions and link them to the objectives or KPIs.
Sometimes the customer has requirements to implement reports or further analysis on top of SSM and these cannot be covered with the standard functionality of the solution. In that case, the best option is to implement the integration between SSM and SAP BusinessObects reporting tools. Some examples of what you can do with that integration:
- Implement bespoke Dashboards with your SSM KPIs and Objectives
- Implement universes and allow users to exploit information from SSM with Web Intelligence without consuming additional SSM licenses
- Implement pixel-perfect Crystal Reports on top of the SSM
- Foster ownership with Publications. For example, send a list of KPI’s that are not performing well to their responsible users
For implementing such integration, you can follow the SAP SSM Configuration guide. However, in some cases, there is lack of documentation and you have to do things outside the script. In other cases, the existing documentation has not been updated yet to BI 4.0 and SSM 10.0. And finally, sometimes the documentation is wrong or the software has bugs and you cannot setup the integration.
In this post we will analyze following scenarios:
- Web Intelligence reporting on top of a SSM Models
- Web Intelligence reporting on top of a SSM Data Model (Clariba-developed solution)
- Crystal Reports on top of SSM (exploring different options)
- Dashboards on top of SSM (exploring different options)
These scenarios have been implemented with following software components:
- SAP NetWeaver 7.3 SP08
- SAP SSM 10.0 SP06
- SAP BusinessObjects BI Platform 4.0 SP05
- Crystal Reports 2011 SP05
- Dashboards 4.0 SP05
1. Web Intelligence reporting on top of a SSM Model
As per SAP documentation, we can setup the ODBO Provider in order to build a Universe on top of SSM Models. The problem is we still have to use the Universe Designer instead of the Information Design Tool of the BI 4.0. Bellow are the steps for setting up the ODBO Provider and implementing your first report on top of the SSM:
- Go to your BO 4.0 server and make sure you have a Multimensional Analysis Service in the BO server. Stop the MDAS Server and the Connection Server in the Central Configuration Manager
- Copy the ODBOProvider folder from the <drive>:Program files (x86)SAP BusinessObjectsStrategy ManagementInternetPub path of your SSM server to the BO server
- In the SSM server, run the SSMProviderReg.bat file in the BO server. Make sure you have administrator rights in the BO server. Once completed, check in the regedit that you are able to find the register SSMProvider.1 in the Windows register
- Modify the windows register to insert following string in that path (assuming that you are using a 64-bit Windows): HKEY_LOCAL_MACHINESOFTWAREWow6432NodeSAPSSMODBOProvider "servletUri"="/strategyServer/ODBOProviderServlet"
- Access the following path in BO server: <drive>:Program Files (x86)SAP BusinessObjectsSAP BusinessObjects Enterprise XI 4.0dataAccessconnectionServeroledb_olap
<DataBase Active="Yes" Name="Strategy Management 10.0">
<Aliases>
<Alias>Strategy Management 10.0</Alias>
</Aliases>
<Library>dbd_sqlsrvas</Library>
<Parameter Name="Family">SAP BusinessObjects</Parameter>
<Parameter Name="Extensions">sqlsrv_as2005,sqlsrv_as,oledb_olap</Parameter>
<Parameter Name="MSOlap CLSID">SSMProvider.1</Parameter>
</DataBase>
- Start the MDAS Server and the Connection Server
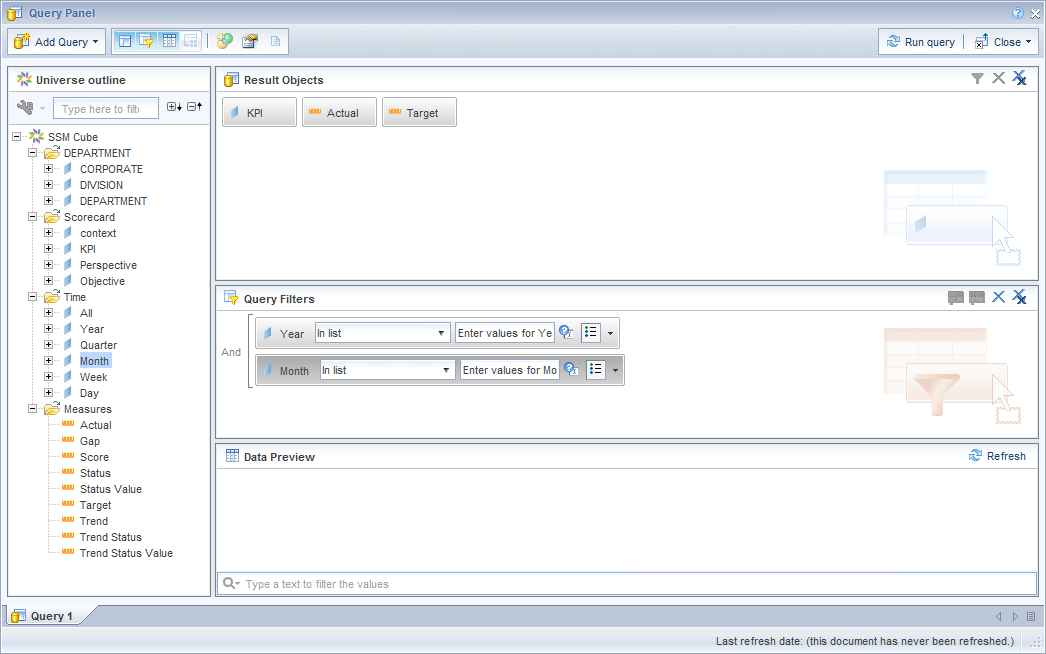
- Now we can go to the Universe Designer and start implementing a Universe on top of our Model. The first step is defining the connection. In the connection list (retrieved from the Connection Server) we can see now the new register we have inserted, Strategy Management 10.0:
- Define the connection parameters. You must be an SSM user with proper permissions and you must inform the server's complete address (FQDN) and its port.


- Once connected to the SSM server, you will see the list of available Cubes. The AS category allows access to the measures (based on attributes and dimensions) in the Application Server model.The SM Adapter allows access to the strategy dimension, which represents the strategy management dimensions Scorecard and Initiative. Scorecard detail not relating to the KPI such as comments are not presented.

- And finally we will see our universe with the available dimensions, the standard classes (Time and Scorecards) and the measures. You can display the technical names of the objects as detail or you can define hierarchies of Perspectives, Objectives and KPIs.

- Now we can publish the universe and go to the Web Intelligence to start implementing our reports on top of the SSM models.
2. Web Intelligence reporting on top of SSM Data Model
That is a solution you can implement if you have an advanced knowledge of the SSM Data Model. You can implement a UNX Universe with the Information Design Tool by linking all the tables of the Entry and Approval, the Nodes of the Scorecard, the Cube Builder or the Initiatives. The advantages of that option is that you have access to extra information not available in the SSM Cube, such as the Initiatives, the users related to specific KPIs, the attributes of the KPIs etc.

If you are interested in such an option, please, contact us. Keep in mind that it is not a supported option from SAP but we have implemented it many times and we know it works.
3. Crystal Reports on top of SSM
The integration of SAP Crystal Reports with SSM can be done by 4 different ways:
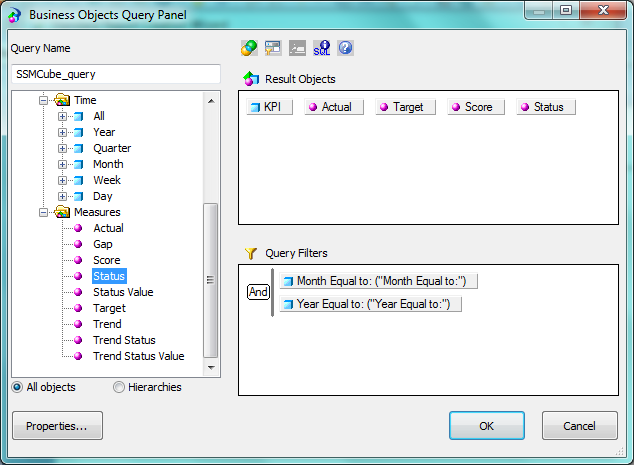
- Implementing a Query as a Web Service from the Universe, built in previous steps: we have managed to implement that scenario
- Connecting Crystal Reports to the Universe on top of the SSM Models we have built in the first step: that scenario is not working although we followed the instructions from SAP
- Using an OLE DB (ADO) connection: this option, not explained by SAP, is available if we install the ODBO provider but we have not managed to make it work

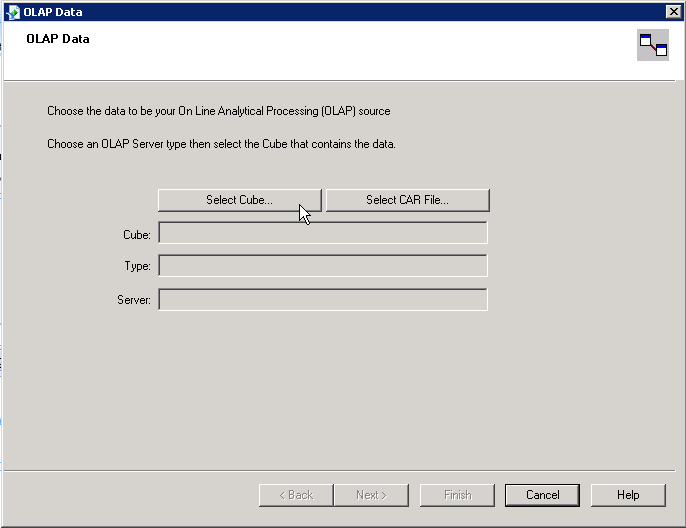
- Using the OLAP Connection: according to SAP Documentation, we can build an OLAP Cube Report in Crystal Reports. We should be able to select the Strategy Management option in following screen to inserts SSM connection data, but we have not been able to find that option

4. Dashboards using Web Services Connections
Using Dashboards, you have two different ways to implement the access to data:
- Implement a Query as a Web Service (QaaWS) to retrieve the relevant information from the Universes we had implemented before.
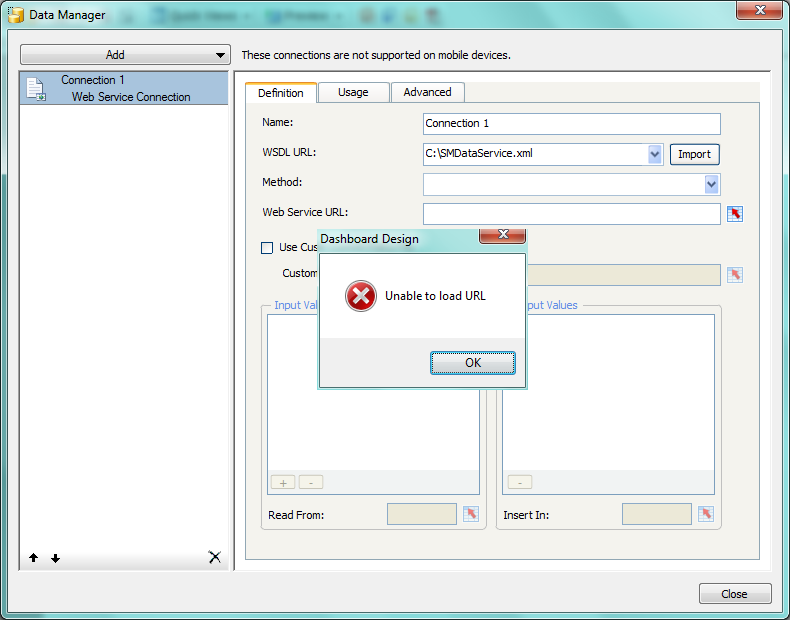
- Use Web Services available in the SAP NetWeaver to retrieve information from the SSM: according SAP documentation you need to download the WSDL file SMDataServiceService and CubeServiceService applications and call the functions within them. With our Dashboards 4.0 SP05 we have not been able to process the WSDL files as the tool is unable to load the URL.
Summary
Providing SAP Strategy Management information to SAP BusinessObjects BI Platform 4.0 can enhance the capabilities of your Strategy system. However that integration is not so easy given the lack of information on that topic and the quality of the existing information. We tried to implement all possible integration scenarios and we have succeeded with Web Intelligence and this is the route we recommend as the scenarios related to Crystal Reports and Dashboards the integration were not working when using SSM 10.0 and BI 4.0.
We will be following-up these issues and let you know if we finally manage to solve them. If you have any suggestions or if you found a workaround to these issues please leave a comment bellow.
Do you know what drives your business?
Knowing your business and making smarter decision in order to keep up with the everyday risks involved in running your business is critical in order to survive in today’s global economy.
 Making effective decisions requires information. This information must be accurate and updated, and in the right level of detail that you need to be able to move forward at optimal speed. Key business analytics is what allows you to draw information from the data you collect in the different parts of your business. When you understand exactly what is driving your business, where new opportunities come from, and where mistakes were made, you can be proactive to maximize existing revenues and reveal areas for expansion. Better decisions can be made when you have more visibility into vital insight coming from your own company.
SAP Business Intelligence (BI) Solutions provides a window into your company. A dashboard for example is a single, reliable, and real-time overview of your company. It offers you quick insight, in visual appealing formats that are easy to understand. You also have "What-If" tests that let you measure the business impact of a particular change. This can also be made available on mobile devices, so you can make informed decisions on-the-move. When you have information you can trust, you are able to act rapidly and stay ahead of the game.
With years of expertise in BI, Clariba has helped several companies to draw insight from their data. For example, Vodafone Turkey´s Marketing department sought our help to provide the Customer Value Management Team with a dynamic and user-friendly visualization and analysis tool for marketing campaigns. With the central dashboard we delivered, the marketing team was able to analyze existing campaigns and design outlines for new ones based on key success factors.
You can learn more about SAP BI solutions here, and you can also watch SAP BI Solutions videos on YouTube. Want to unlock this information on what drives your business forward? Contact us on info@clariba or leave a comment below, and discover how SAP BI Solutions can help you achieve it.
Clariba and Exxova bring you Exxova´s MyBI Mobile at GITEX 2012
Visit Clariba and Exxova at GITEX Technology Week 2012, check out Exxova MyBI in action and enter the drawing for a 10-user implementation of Exxova MyBI Cloud!

Clariba and Exxova will be present at the SAP stand at the GITEX TECHNOLOGY WEEK 2012, the #1 technology fair in the MEASA region, and considered by many, as one of the top information and communications technology (ICT) trade fairs in the world. Over 138,000 ICT Professionals, 18,000 C-level executives and more than 80% of the top ICT brands worldwide are expected in GITEX 2012, which will run from 14 to 18 October at the Dubai World Trade Center.
 As GITEX continues to uncover the latest IT trends, like the shift to enterprise mobility accelerating at a rapid rate on upcoming years, it is unsurprising that we find the “Mobile, Apps & Content” area at the exhibition floor. This is where you will find the SAP Stand. With Mobility at the core of their innovation agenda, and heavy investments to stay at the forefront of the enterprise mobility market, SAP will be present at GITEX , showcasing its leading solutions in mobile device management, mobile applications and development platform among others.
The SAP stand will also feature partners such as Clariba ─ an expert provider of business intelligence solutions and a specialist in SAP BusinessObjects working with Exxova Worldwide ─ global supplier of MyBI Mobile.
 The two companies have partnered to bring Exxova's MyBI Mobile™ solution to the EMEA region. MyBI Mobile is a business intelligence mobility solution, which allows users to instantly access enterprise-wide BI content from mobile devices. It provides business leaders with real-time mission-critical data whether in the boardroom or airport terminal. All existing content is available without the need for rewriting or re-platforming so you can enjoy speed, flexibility, application breadth and simplicity.
- Meet us at our joint pod within the SAP stand in Hall 6, Stand #57 for a hands-on demo of Exxova´s MyBI Mobile and for insights on enterprise mobility and information management from Marc Haberland and David Monks.
- We also invite you to attend our Expert Presentation ─ Information at the Point of Decision with MyBI Mobile ─ at the Seminar Area of the SAP stand, on the 17th October at 12:30, presented by David Monks.
- By visiting us you will be able to enter the drawing for a full implementation of Exxova MyBI Cloud for 1 year for 10 users (worth $5,000!).
“We are excited to go to GITEX; it has become one of the most important ICT events of the year. As a BI services and solutions provider, Clariba believes that it’s important for the entire SAP BusinessObjects BI portfolio to run on multiple mobile platforms," says Marc Haberland, Managing Director of Clariba. “Exxova’s MyBI Mobile solution is a very cost-effective, easy-to-use option to deliver that without compromising data security, and we think this is a great fit with the GITEX technology week, where attendants come to see innovative solutions that can help improve their work processes” Marc comments.
David Monks, Vice President of Exxova EMEA, complements, saying that “the opportunity to showcase our innovative MyBI Mobile solution delivering broad support of Business Intelligence across the SAP BusinessObjects family and beyond in conjunction with our partners Clariba and SAP is an exciting event for Exxova. We look forward to showing how easy it is to deliver mobile BI using Dashboards Design (Xcelsius) Flash-based dashboards, Webi Reports, Crystal and even Explorer onto mobile devices like the iPad without any re-engineering whatsoever and with only 1 or 2 days installation time”.
______________________________________________________________ SAP, Clariba & Exxova can be found in Hall 6, Stand #57 – Mobile, Apps & Content area
For more information on GITEX Technology week visit www.gitex.com
For more information on Clariba visit www.clariba.com or contact us at info@clariba.com.
For more information on Exxova Worldwide visit www.exxova.com or contact us at gitex2012@exxova.com.
Clariba Webinar – Decision Making goes Mobile with Exxova MyBI


Are you looking for a way to access your company data from your mobile device? With Exxova MyBI, you can!
Attend our Webinar (in English) on the 15th of May from 11.00 - 12:00 (UAE - GMT +4:00).
REGISTER HERE
Currently, organizations have made significant investments in developing their Business Intelligence (BI) solutions. In the case of SAP BW and BusinessObjects, business and IT organizations have amassed hundreds of reports using tools such as Crystal Reports, Web Intelligence, and Dashboards (Xcelsius) from SAP. Additionally, significant efforts have been used to establish an enterprise security model. These combined efforts represent a considerable investment.
The existing market perception is that the current mobile devices cannot manage the heavy lifting of the data analytics comparable to today’s advanced and mature BI solutions, so businesses tends to modify their processes and content to adapt to mobile tools.
However, Exxova´s MyBI mobile app allows companies to leverage their previous investments. With it users can instantly access Enterprise wide content at crucial decision points at any location at any time without any major modification to any existing content. Users can print, change, update, and do all of the work that they currently perform on the enterprise system through a mobile device, increasing end user adoption.
We invite you to invest an hour of your time to get to know this solution and see it in action in our MyBI webinar. The agenda for the event is:
- Introduction
- Main features of Exxova´s MyBI mobile
- Main benefits of Exxova´s MyBI mobile
- Demo
- Questions and answers
REGISTER HERE
For More information about Exxova MyBI visit our website.
Best Regards,
Xavier Marigó Sales Manager – Clariba ME
Xcelsius in BI on Demand (BIOD)
In this blog article I am going to talk about Xcelsius in SAP BI On Demand (BIOD). What I am going to explain are the steps that you should follow to upload an existing Xcelsius Dashboard to the BIOD system.
What is BIOD?
First of all, for those who don’t know what is BIOD I will give a brief explanation. Basically we can say that BIOD is the most complete and approachable cloud based business intelligence suite available in the market today. BIOD is software as a service; you do not need to install any software on your machines to get instant value from the system. All you need to do is Log in and provide some data. It is a cheap BI solution, due to the fact that you don’t need to make a huge investment in hardware, licenses, etc... everything is in the net. The target for this technology is small companies, which are less likely to be able to acquire a BI system due to the costs, but with BIOD they have an accesible way into SAP BusinessObjects analysis system. In BIOD you are able to create:
- Xcelisus Dashboards
- Web Intelligente reports
- Explorer
You can get more information about BI On Demand here.
Now, let´s see how to upload an existing XCelsius Dashboard to the BIOD system.
How to upload an Xcelsius Dashboard to BIOD?
First of all, if you don’t have a BIOD account you should create it. It s free, and with it you will able to test most of the features of this cloud system. Click here to Sign up.
Once we are logged, we will see this screen.

Now I want to show you how you should upload an existing Xcelsius file with static data to the BIOD system.
First of all we should create the DataSource, so in my Stuff panel we should select Datasets. After that we click Add New Button -> Add Dataset

Then we should chose from which place we will select the dataset. We have several options: Create From Query (this option is only available in the BIOD Advanced version, where the connection to a universe is possible), bring data from salesforce or create an empty dataset from scratch and finally, we can upload a file (xls,xlsx or csv) which we will use in this example.

As I said before, we select an excel file as source of our dataset, in the first row of our excel file it is important to have the labels of each column. We can also edit this dataset, change the value type of each column, the label name, etc...

At the bottom of this page we can find the properties section, here we should enable the Web service. Once we have done this, the system will generate a url that will be the reference to the dataset in our dashboard.

The next step will be to upload the Xcelsius file as a template, so we select Add New -> Add Template.
We create a name for this template, uncheck the Create a new Xcelsius file check box and finally, select the xlf file that we have locally.

The screen below will then appear. In order to connect the dataset to our xlf file we should select the blue sentence (you may click here to edit the Xcelsius file). You can also attach an image of the dashboard as a thumbail for repository. The object selection will be fancier.

Once the Xcelsius editor is opened we add a connection using OnDemand -> Add Connection menu option. This will create one Flash Variables connection ([Flashvar]) and two Web Service Connections ([OD_Data1 and OD_Data2). In our case we should delete one data connection because we only have one source, but in case we need more data sources we can create as many as we want. It will also create a new tab in the XC spreadsheet that contains these cell bindings.
After that we configure the data connections. Open the Data Manager (Data -> Connections) and you will see a Connection of type FlashVars. You should see the following:
- get_data_url: (mandatory). This should be bound to the cell which the Web Service Url of the Web Service Connections are also bound to. If you have multiple connections this should be bound to the range which holds those connections.

Then each Web Service Connection (OD_DataN), in our case only OD_Data1 points to the set of cells to which that connection outputs its data.
These are the next steps that you should follow in order to setup the dashboard:
- Click on My Datasets and click copy beside the dataset OD_Data1.
- Paste the url from dataset to the WSDL URL input box of a Web Service connection

- Click Import to import the schema.

- Bind the web service url to the same cell as get data url (Note: if you used the Add Connection process this should already be done).
- Bind the headers and the row values.
- Set Refresh on Load to be true.
After these steps you can save your changes and then click the Back button to go back to Edit Connection step of creating a template. You should see your connection listed on the screen.

Click Next to go to the Edit Sample Data step, you can choose to add in your sample data from the XLF if you like, and then click Finish.

Finally we will create a visualization using this template. We select our Data Input, in this case Data Source.

If we go to the visualization menu we can find the object.


In conclusion we can say that the BIOD system is a nice tool to start testing the power of the SAP solutions without a potential heavy investment at the beginning. It can be also a good tool to make demos on and show our dashboards to customers. It is very interesting to test the explorer tool, you can see the amount of options that the BIOD brings you in terms of data analysis. If you are interested in the advanced solution you should get in touch with SAP.
If you have any comment or doubts do not hesitate to contact us or leave a comment below.