""

SAP BusinessObjects and Microsoft SharePoint Integration Capabilities

Nowadays many companies are making a considerable effort to guarantee the constant sharing of information, knowledge and expertise across their organizations. It comes as no surprise that Information Technology plays a key role in responding to this challenge.

A very popular IT solution for organizing enterprise information is the use of company portals. From an IT professional perspective, portals combine enterprise data and applications that reside on the company intranet into a tight infrastructure. From a business perspective, portals provide users with easy access to data and applications through personalized views.

Business Intelligence is also an important part of this discussion for companies that want to use their intranet portal to deliver reports and dashboards to end users. For example, one of our customers has recently asked us to investigate the integration capabilities of Business Objects XI R3 with the leading portal-solution on the market, Microsoft SharePoint.

In this post I will introduce the topic of integration capabilities and benefits. Due to its complexity, this topic also promises to be an interesting focus for future blog articles and continuous technical investigation.

Why Integrate BusinessObjects with SharePoint?

Integrating BusinessObjects with SharePoint allows users to view and manage information within a Single Portal Interface. This integration grants access to all business intelligence resources such as interactive Xcelsius Dashboards, Crystal Reports, Web Intelligence, and any Microsoft Office documents that are stored in the CMS Repository. Therefore, users can navigate BusinessObjects personal/favorites folders, public folders, inbox, as well as personal categories and corporate categories within SharePoint.

The clear advantages for business users are:

  • A unique and easy point of access to any kind of BI content (but not exclusively  BI), compared to InfoView, which is a powerful tool but still represents an additional and restricted interface.
  • A simplified and more efficient use of software licenses, eliminating redundant licenses for those users that are typically viewers of BI content with no need to edit reports. In this case SharePoint allows them to view and refresh Crystal or WebI reports from within the portal.

From a System Administrator point of view, integration with SharePoint offers the possibility of reducing duplication in the backend infrastructure and consolidating BI tools with other technologies in one enterprise portal with a single security model.

While the benefits of such an implementation are clear, I found that there is still some uncertainty surrounding the available options for deployment. Taking into account new and old releases, several different versions of BusinessObjects and SharePoint are being used within organizations today. In the past few years SAP has released multiple versions of the “SharePoint Portal Integration Kit” for BusinessObjects, and both XI R2 and XI R3 can be matched with SharePoint 2003 or 2007.

Both BusinessObjects Enterprise and Edge customers are entitled to download the integration kit from the SAP developers’ portal. Moreover, although it’s not specifically advertised by SAP, there is evidence of successful implementations of BusinessObjects XI 3.1 with Java InfoView interfaces on www.forumtopics.com/busobj. This suggests that even companies that are not using a .NET interface will be able to exploit the integration capabilities of BusinessObjects with the portal.

However, a .NET interface seems to be the ideal condition for achieving full integration with the Microsoft platform. In fact, the integration kits for Microsoft SharePoint 2007 and Microsoft SharePoint 2003 have gained acceptance in the marketplace but have limited capabilities. As a result, SAP recently released an additional product, with the intention of providing all of the .NET InfoView capabilities from within the SharePoint interface. The product has been released with the name of "Integration Option for Microsoft SharePoint software 1.0".

The following table, from an official SAP source, clearly shows how superior this option is compared to the previous integration kits:

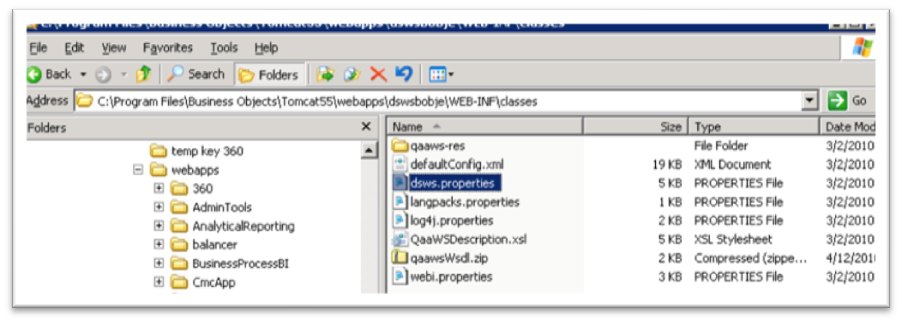
Further information on the available SharePoint integration kits can be found on www.sdn.sap.com. Integrations kits are free of charge and all direct zip file downloads are available here.

On a final note, it is worth speculating on what is to come in the near future. Regrettably, the current versions of the PIK and the IOMS do not provide an option for integration with SharePoint 2007 64bit. All existing products integrate with 32bit versions of SharePoint. But not to worry; with the recent launch of SharePoint 2010, available in 64bit mode only, SAP is catching up with an ad hoc version of the PIK. According to rumors on the SAP developers’ forums, the 64bit integration kit will be released by mid 2011, following the launch of BusinessObjects XI R4 later this year.

Will this be the chance to improve the integration capabilities with Java InfoView interfaces… We can’t say just yet. But stay tuned for updates on this topic and for more technical insights in future blog articles.

Catch Clariba at the SIMO Network Trade Fair in Madrid from October 5-7

Barcelona, Spain: Clariba is proud to be one of the select partners exhibiting in the SAP Partner Zone at the SIMO Network Trade Fair in Madrid this week.

The SIMO Network brings companies and individuals together to exchange business and technical knowledge. Organized by IFEMA and held in the halls of Feria de Madrid, this annual meeting features commercial exhibitions, seminars, debates, and a wide-ranging program of activities for information and communications technology professionals. Last year 21,000 visitors attended the SIMO event over the course of three days.

The event is centered on four key areas: infrastructure and systems; business tools and solutions (including business intelligence); telecommunications and internet; and sector organizations and institutions.

As specialists in the planning, installation, development and deployment of business intelligence solutions, Clariba is well positioned to provide expert BI advice to visitors at the SIMO Network event. A strong partnership with SAP enables Clariba to provide the best solutions to customers, from data management to the development of reports, dashboards and scorecards.

Members of the Clariba BI team will be unveiling the new Clariba Showcase for SAP BusinessObjects at the Clariba stand in the SAP Partner Zone from October 5-7. This showcase features interactive and highly visual dashboard, scorecard and reporting solutions for a variety of industries and business units. In addition, the team will be on-hand to answer questions and discuss the benefits of business intelligence.

“Clariba is pleased to be an exhibitor in the SAP Partner Zone at the SIMO Network Trade Fair in Madrid”, comments Marc Haberland, Managing Partner of Clariba. “We look forward to showcasing our business intelligence expertise and meeting with IT and business decision makers to discuss SAP BusinessObjects solutions during the three-day event.”   

The SIMO Network Trace Fair in Madrid takes place at October 5 – 7 in Hall 10 and the North Convention Centre of the Feria de Madrid from 10:00 a.m. to 7:00 p.m. daily. Visitors are welcome to register at the door on October 5. For more information on the event please visit www.simonetwork.es.

About Clariba

Clariba delivers innovative, reliable and high-quality business intelligence (BI) solutions to customers worldwide. We are recognized and respected as one of the leading SAP Business Intelligence consultancies in EMEA. Clariba develops best practice BI solutions for dashboards, reporting and analysis, providing our customers with clarity and actionable insight to improve their business performance. Our customers in Europe and the Middle East are leaders in the telecommunication, education, manufacturing, and banking sectors. By working closely with business leaders and IT teams, Clariba turns vital data from ERP, CRM and other transactional systems into actionable insight for all levels of the organization. For more information on Clariba’s business intelligence solutions visit www.clariba.com or contact us at info@clariba.com.

Doing BI Right: Why you need a proper business intelligence methodology

We have often faced situations where people thought that the mere fact of having a Business Intelligence tool and qualified consultants were enough to guarantee a successful BI implementation. However without a good BI methodology it can be difficult to meet deadlines, satisfy all the users and stay within budget, even with the best of intentions.

In this post I will briefly talk about some aspects of a methodology that we have implemented with some of our customers.

Distinction between power and normal business users

Accuracy of the reports is key to people who want to ensure that they are making the right decisions. Therefore it is important to always have a group of power users who can work on difficult reports and are able to understand how the data is modeled. These people usually work on predefined reports as well as difficult ad-hoc analysis.

Normal business users usually work on personal and ad-hoc reporting. They want to get their questions answered very quickly, but for that they need to have very good and simple universes. For example, most of these types of users are not comfortable working with universes that have contexts.

Implementation of a good business gathering scenario

From our experience, gathering business requirements properly leads to the correct delivery of complex analysis to the business.  We have had the best results when the requirements gathering process has been:

  • centralized: the business should always think of a single point of access for business requirements gathering. If this is not centralized, the process can be hard to define.
  • recurring: it should also recur regularly as a proper business gathering process is never finished. We have usually set recurring meetings (weekly, twice per week) where some people from the reporting team meet their business sponsors and agree on the next actions to take.

Implementation of a good lifecycle and version control tool

When working with large enterprise customers (with many developers) it is always good practice to implement a version control tool as well as a workflow in order to promote content from development environments to production.

With version control tools the developers can share, lock and control their versions so everything is kept under control. This is especially important in large environments.

It is also important to have a criteria list of points that the reports should meet before they are promoted to production. This way, we make sure that whatever is in production has been properly tested and confirmed (the criteria can refer to query performance, layout format, etc.)

There are many third party applications that offer the version control as well as the lifecycle management functionalities.

Distinction between personal and public areas

BusinessObjects already makes the distinction between personal and public folders.  This point goes together with the previous point. We have always implemented the lifecycle processes under the public area so this basically becomes a read only area in production.

By doing this we achieve the following:

  • Users can be confident about all that is under the public folders as that content meet the proper criteria before it has been promoted to production
  • Public folders are cleaned
  • Public folders are tidy

If you are about to undertake a new BI project, especially one in a large customer environment, I hope the tips above will be useful to your team as you build your own best practice BI methodology. If you have any ideas to add or any feedback about my suggestions, please feel free to leave a comment below.

SAP Social Network Analyzer: Old Concept, New Horizons

A social network is a structure composed by interconnected elements. From a network theory point of view, the so-called “nodes” can be individuals or organizations and are connected to each other interdependently by various types of relationships.

The concept of a social network is not a new idea. In fact, the term has been used for over a century, although complex relationships between members of social systems have been out there from the very beginning of human existence. However, social network analysis is an area that is constantly evolving and has become a key technique in modern sociology. Other professional sectors are also interested in following the trends, such as marketing, information technology, communication, economics, geography, sociolinguistics, anthropology, biology, etc.

There are some factors that are definitely fueling this interest: the proliferation of social networks on the Internet (with a constantly increasing penetration rate) and the evolution of mobile devices (smart phones) that integrate most of these social networks in a single point of access.

The fact that more and more people are entering and storing data on the Internet makes it an incredibly good source for profiling, niche marketing, customer outreach, etc. Many companies have already started producing revenue thanks to their social networking efforts over the past few years.

There are many social network analysis tools in the market, but this article is based on the approach by SAP BusinessObjects. Social Network Analyzer (SNA), which started as an SAP internal tool, aggregates existing enterprise data to display and discover organizational relationships.

It automatically generates useful social networks that can be used to:

  • find and connect people
  • take actions based on individual/organization/company information
  • send an email, meeting request or call a person
  • build the right team
  • better manage and control processes
  • understand the relationships between suppliers and buyers
  • analyze people’s information and organization using BI tools
  • integrate social network information inside any application...

The tool allows users to get a deeper understanding of the contacts by using different features and filters. For example, the Refine tab allows you to filter your results by location, role, project, company, etc.

The Explore tab helps you to understand the relationships and connections to other individuals or groups, such as business contacts, teams and reporting hierarchy.

SNA is an interesting way to look at networks within or across organizations. An on-line demo allows you to test the product and see how intuitive and navigable it is. Follow this SAP URL to learn more: http://sna-demo.ondemand.com/SNA.jsp. It’s time to get social!

Improving the Performance of Xcelsius files with OpenOffice

During the past few months my coworkers and I have been working with Xcelsius on a regular basis to develop dashboard for our customers. Sometimes we face challenges when we generate a swf file from an xlf file in Xcelsius and we don’t know why. Other times, Xcelsius crashes during the generation of the swf file. Even when the swf generates correctly, we occasionally see dashboard performance issues (i.e. when we execute the Xcelsius swf file, the load time is very slow).  However, we have found a trick that can be used to resolve these issues.

In this post I will explain the results of two tests that we did to reduce xlf file sizes followed by the steps you can follow to achieve these results.

The main idea of this trick is to reduce the size of the xlf file using OpenOffice software. Let me start by showing you the test results:

For the purpose of this test, we created an Xcelsius file called TestCompression.xlf

First we exported the xls file from the Xcelsius file by selecting Data -> Export:

We then saved the xls file. As you can see in the screenshot below, this generated a 2,264 KB xls file, so our objective was to decrease this file size.

Next we opened the xls file with Microsoft Excel and without modifying anything we saved it using another name. We repeated the same steps but this time with OpenOffice. In the image below you can see the decrease in size of the xls file. The size difference between the original xls file and the OpenOffice xls file is quite significant.

Finally we imported the new xls file into Xcelsius by selecting Data -> Import

In the screenshot below you can see that we decreased the xlf file size using the OpenOffice xls, but the change wasn’t very significant. TestCompression-OpenOffice.xlf is 1,117 KB, compared to the original TestCompression.xlf which was 1,236 KB.

As a result, we decided to test with another xlf file, which included hard coded data, to see if the compression would be more significant. For the second test, we achieved the following results after completing the same steps as outlined above.

In this screenshot we can see a significant decrease in the file size of the OpenOffice xlf with hard coded data. The original file TestCompression2.xlf file was 1,241 KB and the final TestCompression2-OpenOffice.xlf file was less than half the size (577 KB).

As a result of these two tests, we observed the following:

  • Each time we modify an Excel Sheet inside Xcelsius, the size of the xls file increases.
  • When the original xls is very large, the decrease in size is more substantial when we use OpenOffice.
  • If we have hard coded data in the Excel file, we notice a greater size decrease than if we have QaaWs (Query as a Web Service) or Live Office Connections in the Excel sheet.

From now on, each time we attempt to generate a swf and we have made modifications (to data or Excel formulas) inside the Xcelsius Excel Sheet, we follow these best practice steps:

  1. Export from Xcelisus to xls file
  2. Open xls with OpenOffice
  3. Save it as xls file with new name
  4. Import to Xcelsius

In terms of speed, we notice changes in the swf loading process especially if most of our data is hard coded.

Finally find below a summary of the results obtained:


If you have experienced a similar situation with your Xcelsius files, I would be interested to hear how you have managed to reduce the file size. Also if you have any suggestions or feedback about my methods in this post, feel free to leave a comment below.

Weekly Reports: An inside look at the week format results in Oracle Database and SQL Server

Weekly reports are usually requested by customers who want to follow their activity results by weeks running from Monday to Sunday. The most common way to collect weekly data is by grouping date ranges by their Week No. of the Year. 

As you will see in this post, when I started  investigating this topic I found some interesting information about the week format in both Oracle Database and SQL Server, which I hope will be useful to others using these tools.

Oracle Database

Throughout my many years working with Oracle I assumed that the ‘ww’ mask returns the Week No. of Year according to the standard week (running from Monday to Sunday). After doing some queries I was surprised to discover that days belonging to the same week can actually have a different Week No depending on the day of the week that the year started.

For example, Week 1 of 2010 started on a Friday, therefore every Week No in 2010 will run from Friday to Thursday:

After some research I found the following documentation for Oracle DB that provides an additional explanation on this subject:

http://download.oracle.com/docs/cd/B10500_01/server.920/a96529/ch7.htm#5186

By applying this new knowledge to the previous query I was able to compare the two methods:

SQL Server

For those of you who are SQL Server programmers, I have also done some investigation on this subject. SQL Server 2008 supports ISO week as an argument of its DATEPART function. Prior versions use the regular ‘ww’ or ‘wk’ mask based on January 1st. The first day of a week is defined in the DATEFIRST session setting which by default sets Sunday to be the first day of the week.

You can use this user defined function for calculating the ISO week number in prior versions of SQL Server 2008 as follows:

After implementing the function above, you can run the following query to compare the common week mask and ISO week:

Notice that Friday is numbered as the 6th day of the week. The first day of a week depends on the DATEFIRST session parameter, which by default is set to 7 (weeks start on Sunday and end on Saturday).

  • To see the current setting of DATEFIRST, use the @@DATEFIRST function.
  • The setting of SET DATEFIRST is set at execute or run time and not at parse time.
  • To set Monday as the first day of the week execute:

To finish off, I would like to list some advantages and disadvantages about using ISO week numbering:

Advantages:

  • All weeks have an integral number of days (i.e. there are no partial weeks).
  • All years have an integral number of weeks.
  • The date directly tells the weekday.
  • All weeks of the year start on a Monday and end on a Sunday.
  • When used by itself without using the concept of month, all the weeks in a year are the same except that some years have week 53 at the end.
  • The weeks are the same as used with the Gregorian calendar. Dates represented as yyyy-Www-d or yyyyWwwd can be sorted as strings.

Disadvantages:

  • Not all parts of the world have a work week that begins with Monday. For example, in some countries, the work week may begin on Saturday or Sunday.
  • In the link below you can find an extended list of countries and their week numbering rules: http://www.pjh2.de/datetime/weeknumber/wnc.php?l=en
  • Many organizations use their own calendars which do not follow ISO standard (i.e. Fiscal calendars or academic calendars).

In summary, things are not always as they seem. As my professors always told me, in the business of computer science we can never afford to make assumptions and should always read the documentation and check sources.

I would be interested to know if anyone else has additional information or comments to share on this topic. Please feel free to leave a comment below.

Gain Powerful Analysis for Financial Management with Clariba Finance Central

Clariba is pleased to announce the release of the Clariba Finance Central demo, which highlights our latest financial management solution powered by SAP BusinessObjects. This BI solution was developed for one of our telco customers but is applicable to any corporate finance department in any industry.

The customer challenge that lead Clariba to develop this financal management solution was two-fold. From an IT perspective, the team spent 2 business days each month downloading information from the Hyperion Financial database and manipulating the data with other spreadsheets to create a set of graphs and tables. These graphs/tables were then copied and pasted in to a PowerPoint for the monthly management pack. The challenge from the business perspective was that the CFO had to wait several days for the information to be prepared and the overall reporting process lacked visual analysis capabilities.

Based on these challenges our customer wanted to consolidate their financial information and access it easily, gain better analysis capabilities (mainly to do with enhancing the visual components and enabling easy comparisons), and automate the financial reporting process to reduce monthly manual efforts and decrease errors. As a result Clariba developed centralized financial information in an easy-to-use dashboard allowing for extended analysis in a highly visual format.

"The Finance Central solution is completely automated, user-friendly and standardized, providing actionable insight to business users of all levels, including the CFO, and it can be adapted to any data source," comments Marc Haberland, CEO and Managing Partner of Clariba.

Clariba Finance Central was developed using several tools in the SAP BusinessObjects stack including: Data Integrator (to consolidate and aggregate the required KPIs in a finance datamart), BusinessObjects universe (with Query as a Web Service) and Xcelsius (for the interactive dashboard).

For more information about the Clariba Finance Central solution or our customized solutions for a variety of industries and functional areas, we invite you to contact us at info@clariba.com.

Real Time Dashboards – Lessons Learned

There are some scenarios in which a fast pace is required for data monitoring. This is where real time dashboards come in. A real time dashboard can display information with a high degree of frequency. This information is used by the audience to make quick decisions to correct the behavior of certain foreseeable trends. Real time dashboards can also set off alerts based on business thresholds allowing the audience to react quickly based on up-to-the-minute information.

Real time business intelligence is relevant to multiple industries and departments. Dashboards can be used to monitor call centre performance, IT system usage, data security, dynamic pricing, and inventory optimization and even support fraud detection and risk management efforts. Based on our experience building a real time dashboard to monitor call center data, this article will highlight tips and lessons learned for anyone who is undertaking a similar project.

ETL

Scheduling Frequency In reality the dashboard is not real time. It is a batch job with a very short refresh/update frequency. In our case it was 1 minute, which is also a limitation on Data Services batch jobs. It is important to know these limitations and also to know how fast your entire ETL batch job can run.

If batch job total duration > batch job run frequency then you will create overlapping processes which can immediately cause two issues:

  1. Overload your server or generate refresh slow downs

  2. Create inconsistencies in your data if your ETL does not correctly do blocks and queues write process to DB tables.

Run Optimization Given the need presented above: batch job total duration < batch job run frequency, you must search for the optimal setting to run your batch job. In Data Services there are some situations that can easily speed up your job execution but there is a delicate balance you must consider. One example is the memory method it uses to run the batch job, which can be selected from:

  • Pageable

  • In Memory

Pageable

Also whenever you have a table comparison process, the performance can be optimized by running the comparison as a separate process.

Table comparison

The In method runs faster when your server has enough RAM resources, however if your server does not have enough free RAM it will overload and will not be able to catch up with new spawning processes, running lower and lower in physical memory until it causes a complete  server crash.

Tomcat

Memory management Tomcat, under determined circumstances, does not perform well with memory management and garbage collection. When executing several QAAWS every minute the memory it uses can build up very quickly. Any Tomcat service on a 32bit Windows environment will have a limitation of 1.2 GB of memory to allocate. Tomcat becomes unstable when it reaches that limit and new requests are still coming in at a constant rate.

There are several tweaks on Tomcat and JVM memory  that can be done to optimize this.

One example of these tweaks is the memory limits that can be set when Tomcat is started; these can be set using windows registry or run time modificators.

Cache Optim flag The QAAWS application that comes bundled with Business Objects has a limitation set to cache data requests. When the same request is done in short periods of time the cache data is sent instead of running the query again. To avoid this and get new data every time, you need to disable this functionality on the dsws application properties:

dswsproperties

To disable it, you need to set the qaaws.cache_dpresult.optim flag to false.

qaaws cache

Restart Script In order to keep Tomcat service from memory overloads it is a good practice to schedule an overnight restart that will force garbage collection. The script can be very basic or contain additional cleanup tasks.

Script

HTML Container Placing the flash file on  html container will allow you to execute some actions prior and during the flash file execution. You can run javascripts, pass mandatory flash variables (i.e. suppressing tomcat error messages when running qaaws), etc.

The most basic html container for an xcelsius flash file will look as follows:

Xcelsius flash container

Auto refresh Java script As mentioned before, an HTML container will allow you to run javascript programs on the Explorer window executing your xcelsius flash file. Many applications can be given to javascript but one of them could be the browser page auto-refresh function. With the refresh you can wipe out outdated errors from screen.

No Error flash Variable The no error flash variable is a new functionality on Xcelisus SP4. It allows you to set the pop-up error windows off in cases where the error is not directly related to Xcelsius logic, i.e. Tomcat outages, scheduled system restarts, etc.

To add this functionality to any Xcelsius dashboard you need to add the flash variable input to your xlf file first.

Flash Variables

Finally you also you need to pass the variable to the SWF as indicated in the HTML container code example above.

I hope these lessons learned are helpful to anyone working on a real time dashboard. Feel free to leave a comment or question below if you need more information on any of the tips provided in this post.

Working with multi-sections in SAP BusinessObjects Query & Analysis tools

Sections are traditional features in the SAP BusinessObjects Query & Analysis (QA) tools. They provide a list of items and their associated partial report, including table(s), graph(s) or both. This is very powerful, as you may imagine. As an example, a mobile phone bill is created from sections by subscriber, associating every subscriber with his/her own bill.

This blog article will describe a particular requirement together with a challenge that we faced in a real scenario and how it was resolved.

The initial requirement

In this scenario we were working with a telco company that had a systems containing its billing data. From this the requirement was to develop a table with every subscriber’s call details, as well as a graph with the last 12 months total consumption. Moreover, there were three other conditions:

  • The subscribers are often grouped by company, so the total bill by company must be generated – same report –
  • The resulting pdf must show Company / Subscribers, in this order, and allow users to navigate across the pdf
  • At the request of the customer, the report must be done in the traditional Desktop Intelligence tool

The challenge

Starting a mockup with WebI, we built the query, dragged & dropped 2 sections (1 by company, 1 by subscriber), drafted the table and the graph, adjusted the width of sections manually so each one fell into one sheet, refreshed, exported to pdf and “voilà”, the draft seemed to accomplish our specifications.

PDF document saved from WebI

Pdf document saved from WebI with navigation to sections and subsections (each one in a different page)

When we tried with DeskI, we followed the same steps; setting the “start on a new page” and the “avoid break page in block” to active, but we still ran into the issue of a blank page. This was due to the fact that between the section and the first item of the second subsection, the "start on a new page" was not applied automatically, so we had to create it ourselves. As our bill layout was quite large (and took up the whole A4 page), the report ran onto the following page (that is to say, the end of the section), so an empty page was generated just after.

Manual editing in DeskI

In DeskI the distance between the section and the 1st item of the 2nd subsection needs to be adjusted manually

Our solution:

The solution in DeskI was based on incremental actions. We have highlighted the advantages(+) and disadvantages (-) to give more insight into our situation:

1. Remove the “Start on a new page” option for the subsection (+) The blank page disappears (-) 1st sub-item navigation issue: The 2 lines from section / subsection appear in different pages, so PDF links do not work properly, as the button from 1st item in subsection stays in section page

2. Add a cell at the end of the first section table and graph (+) The 2 lines from section /subsection always appear in the same page, so PDF links work properly (-) In the specific case that a company does not have a subscriber, there is an empty page between companies, as 1st section ends up in the next page

3. Hide the auxiliary cell in cases when a company does not have a subscriber (+) Create a condition based on a count of subscribers inside the company, and hide the cells if that count is zero (-) None Conclusion

What we learned from this scenario is that traditional tools like Desktop Intelligence really do provide great flexibility but you have to have experts on hand who constantly push them to the limit. On the other hand, when possible we should tap into the power of Web Intelligence, which combines the Query & Analysis strength of its predecessor together with a functional capability tailored to the current web based world needs.

Feedback and questions are always welcome. If you have similar challenges, we would be happy to share our insight.

Connecting SAP BW and BusinessObjects Data Integrator for data extraction

In follow up to my blog article on July 7, I would like to share some insight for connecting SAP BW and SAP BusinessObjects Data Integrator for the purposes of data extraction.   

 The problem that I encountered was that I could not connect my BODS to SAP BW. The connection was correctly created into the Management console of Data Integrator but the start up was always failing. 

After what seemed like hundreds of tests and commands from the cmd, I found the solution: the services file contained in the same path as the host file (windows/system32/drivers/etc) requires a small change:

  1. You need to add the following string SAPGWxx  33xx/tcp where xx is the system number of your SAP connection.
  2. Then here I also configured the sapjco3.jar that is stored in tomcat (you will find it with an easy search in the folder) in the Tomcat CLASSPATH as per the previous topic posted on July 7.

To start the service I used a command from the cmd in the location: Drive:Business ObjectsBusiness Objects Data Servicesbin: RfcSvr -aRFC_ProgramID -g/H/ip or name of the SAP Application Server name/S/33xx -xsapgwxx   RfcSvr is the .exe file that starts the DI processes. If you want to know more details regarding this command, the best way is to do a quick search in Google.

After following the steps above, everything should work fine. At this point, you can use BW cubes as your data source in Data Integrator.

If you have any questions or feedback to add to this quick solution, please feel free to leave a comment below.