
Machine learning has become a central topic of interest in the media, thanks to its recent successful applications in creating value in a variety of business scenarios. At Clariba, as experts in predictive analytics, we are active agents of its adoption and democratization, since we have been applying ML in our predictive solutions for a long time. When used wisely and with the proper methodology, Machine Learning techniques can offer an increase in performance to businesses and organizations of all types.
With this series we aim to introduce newcomers to the different types of Machine Learning, its main techniques and algorithms and their business uses. We want also to help demystify the term and provide our clients and prospects with ideas on how to integrate ML into their daily operational and decision-making processes.
WHAT IS MACHINE LEARNING?
The name machine learning was introduced by Arthur Samuel in 1959. It is a field of science that explores the development of algorithms that can learn from and make predictions on data. The main difference with other common algorithms is the ‘learning’ piece. Machine Learning algorithms are not series of processes serially executed to produce a predefined output. They are instead series of processes aiming to ‘learn’ patterns from past events and build functions that can produce good predictions, within a degree of confidence.
Within the field of data analytics, machine learning is part of a piece known as predictive analytics.
TYPES AND USAGE
As we just described, the learning piece is what best defines this kind of algorithms. Depending on the type of learning, they are commonly divided into supervised, unsupervised, semi-supervised and reinforcement learning algorithms.
We will start this series with an example of supervised learning algorithms.
Supervised learning algorithms try to find relationships and dependencies between a target output we want to predict – ranging from churn to insurance fraud or potential success of a sales promotion on different individuals - and data we have from other individuals from the past, including demographic characteristics or previous behavioural data. We use this past data as input variables to predict the most probable output value for new data, based on those relationships learned from previous data sets.
The most typical supervised methods are:
Decision Trees
Linear Regression
Nearest Neighbour
Naive Bayes
Support Vector Machines (SVM)
Neural Networks
DECISION TREES
Classification and Regression Trees are commonly referred to as CART. The term was introduced by Leo Breiman to refer to Decision Tree algorithms that can be used for classification or regression predictive modelling problems.
The CART basic algorithm is the foundation for more advanced algorithms like bagged decision trees, random forest and boosted decision trees.
Decision trees are typically used to predict the probability of achieving an outcome for a new observation (individual, client, …) based on its attributes (age, demographics, purchase behaviour, …), by using previous data we have from a sufficient number of similar observations or individuals. The outcome to predict is normally binary: yes/ no (will churn/ won’t churn, will buy / won’t buy, …).
They are called trees because they can be represented as a binary tree where each root node represents a single input variable (age, city, segment…) and a split point on that variable (assuming the variable is numeric). The leaf nodes of the tree contain the output variable (will buy, will churn, …) we want to predict.
Let’s start with a simple example, where we will try to predict gender based on height and weight of people. Below is a very simple example of a binary decision tree:
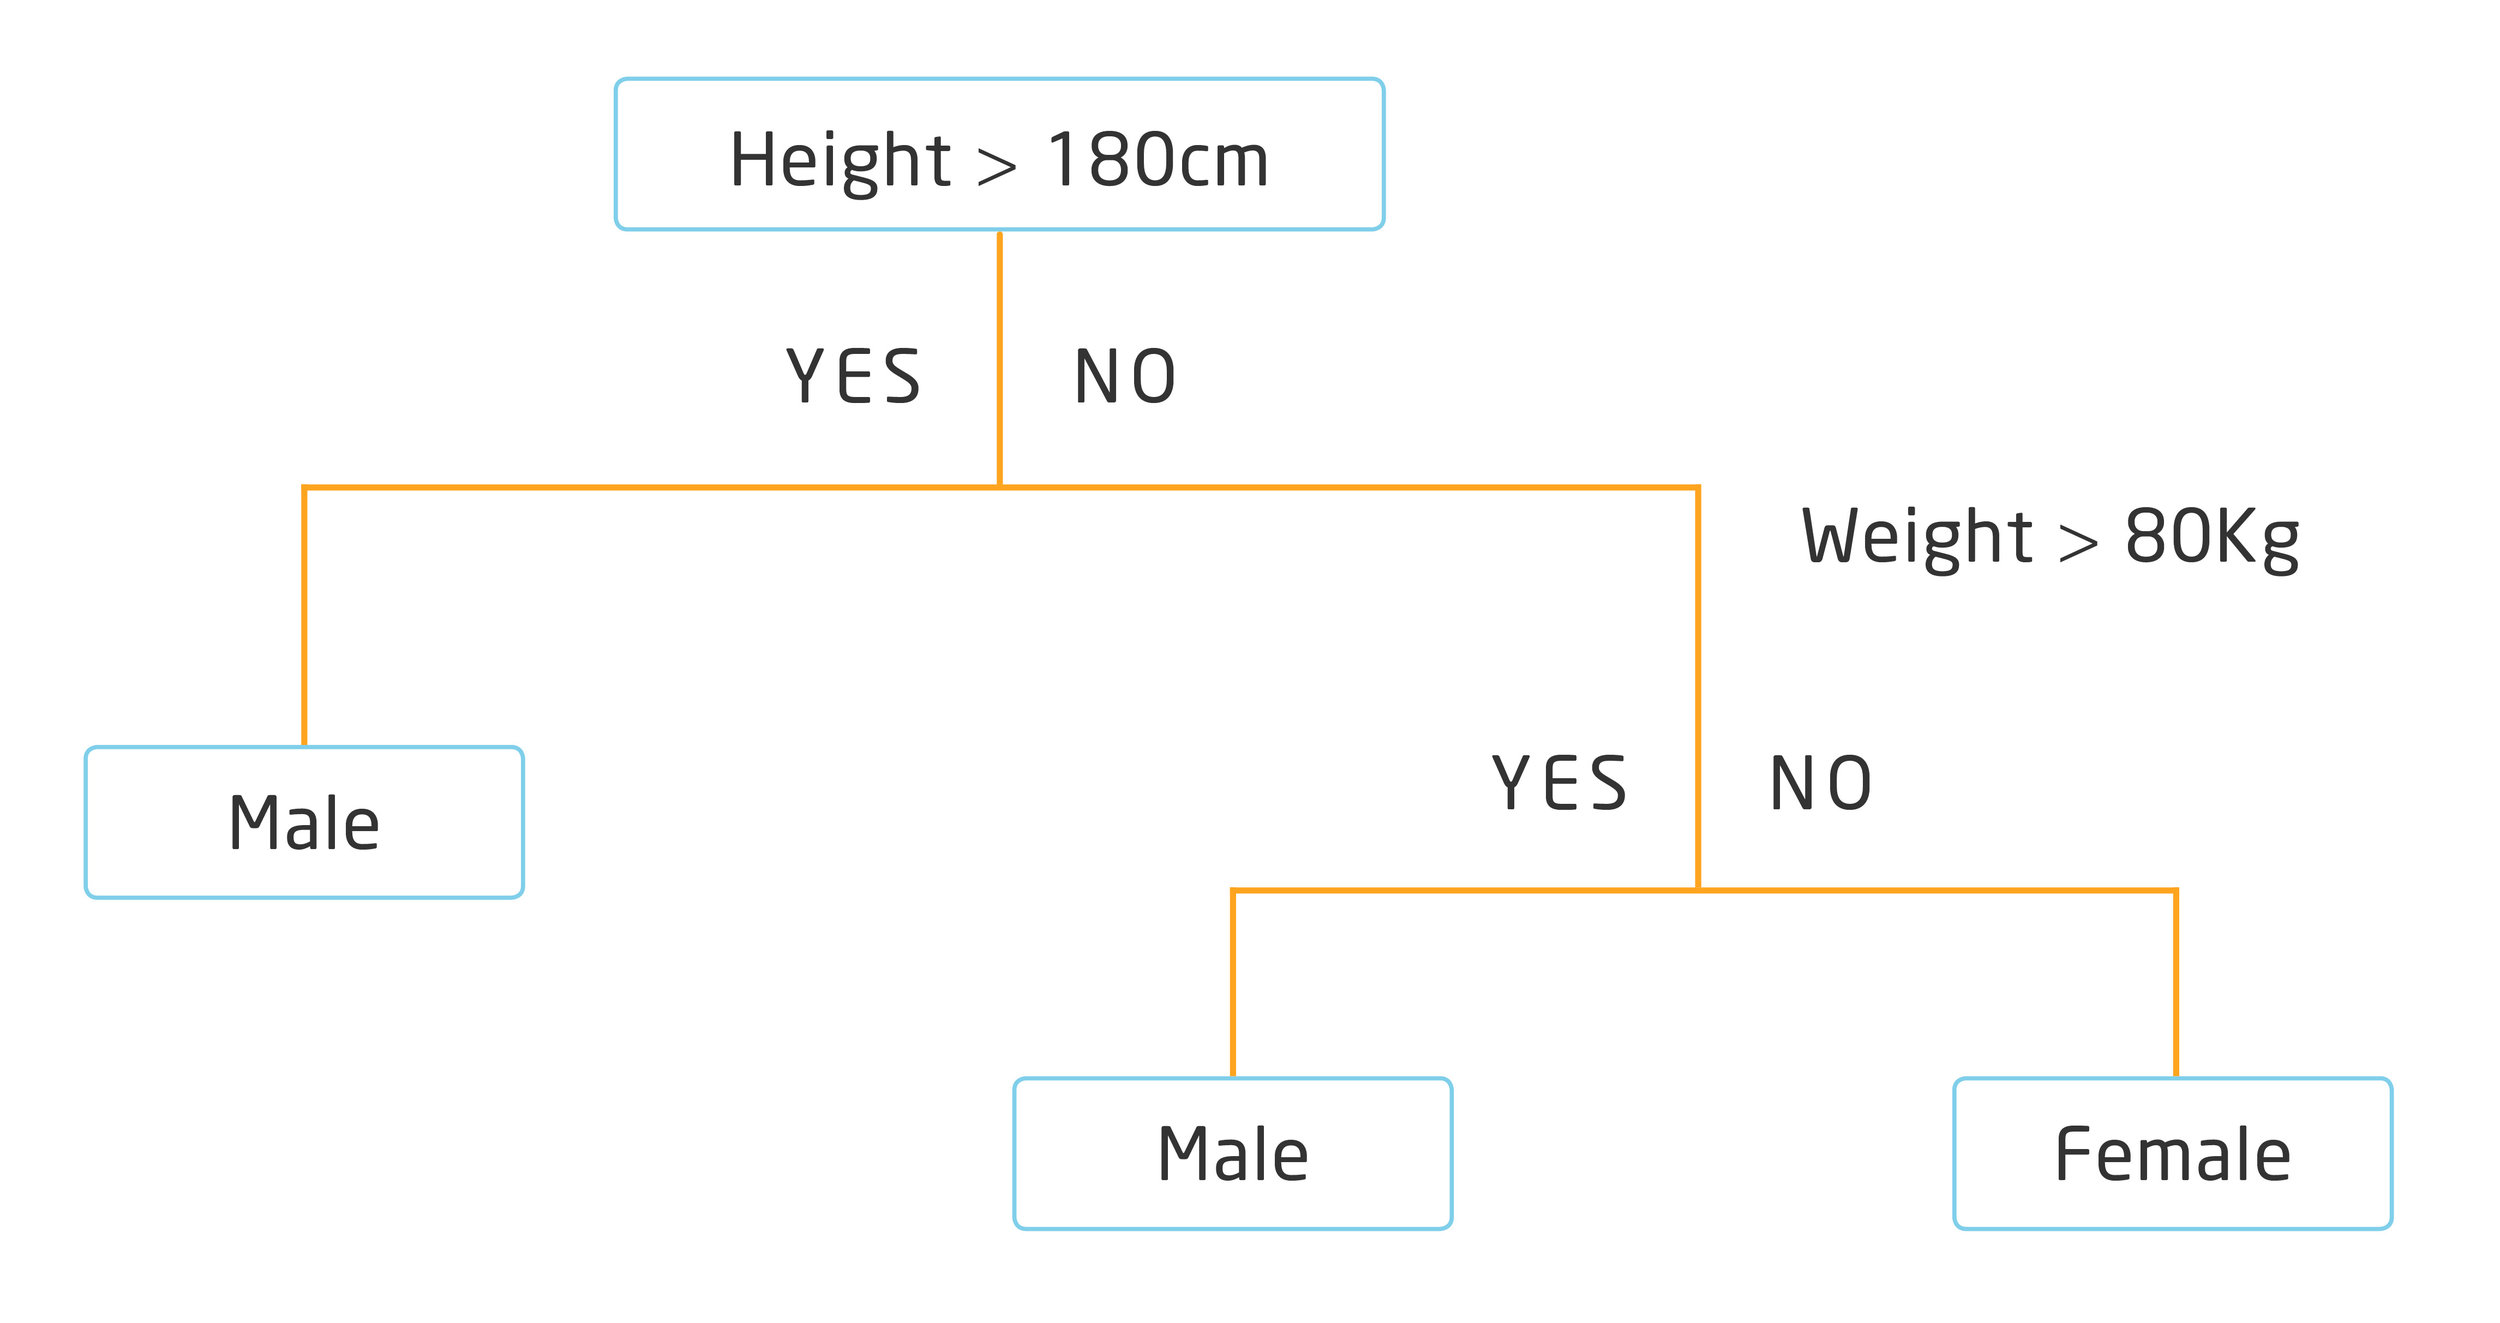
The tree can be represented both as a graph or as a set of rules. For example, below is the above decision tree, described a set of rules:
If Height > 180 cm Then Male
If Height <= 180 cm AND Weight > 80 kg Then Male
If Height <= 180 cm AND Weight <= 80 kg Then Female
With the binary tree representation of the CART model described above, making predictions is relatively straightforward. Whenever we evaluate a new individual, we can predict their gender based on height and weight, within a degree of confidence.
Let’s see a decision tree in action, to help a US-based Telco company prevent churn.
BUSINESS CASE EXAMPLE: CHURN PREVENTION IN A TELCO
We have a sample dataset with the following attributes from a significant number of customers:
State: 2 characters representing the State
Account length: age of the account in days
Area code: postal code
International plan: Boolean yes/no explaining if the client has an international plan contracted
Voice mail plan: Boolean yes/no showing if the customer has a voice mail activated
Number vmail messages: total number of voice email messages managed
Total day minutes: average minutes of voice calls during daytime, per month
Total day calls: average number of calls during daytime, per month
Total day charge: average spending on day calls, per month
Total eve minutes: average minutes of voice calls during evening, per month
Total eve calls: average number of voice calls during evening, per month
Total eve charge: average spending on voice calls during evening, per month
Total night minutes: average minutes of voice calls during the night, per month
Total night calls: average number of voice calls during the night, per month
Total night charge: average spending on voice calls during the night, per month
Total intl minutes: average minutes on international calls, per month
Total intl calls: average number of international calls, per month
Total intl charge: average spending on international calls, per month
Customer service calls: number of calls to customer service
Churned: Boolean true / false meaning they churned from the company or they didn’t. This will be our target variable to predict and prevent.
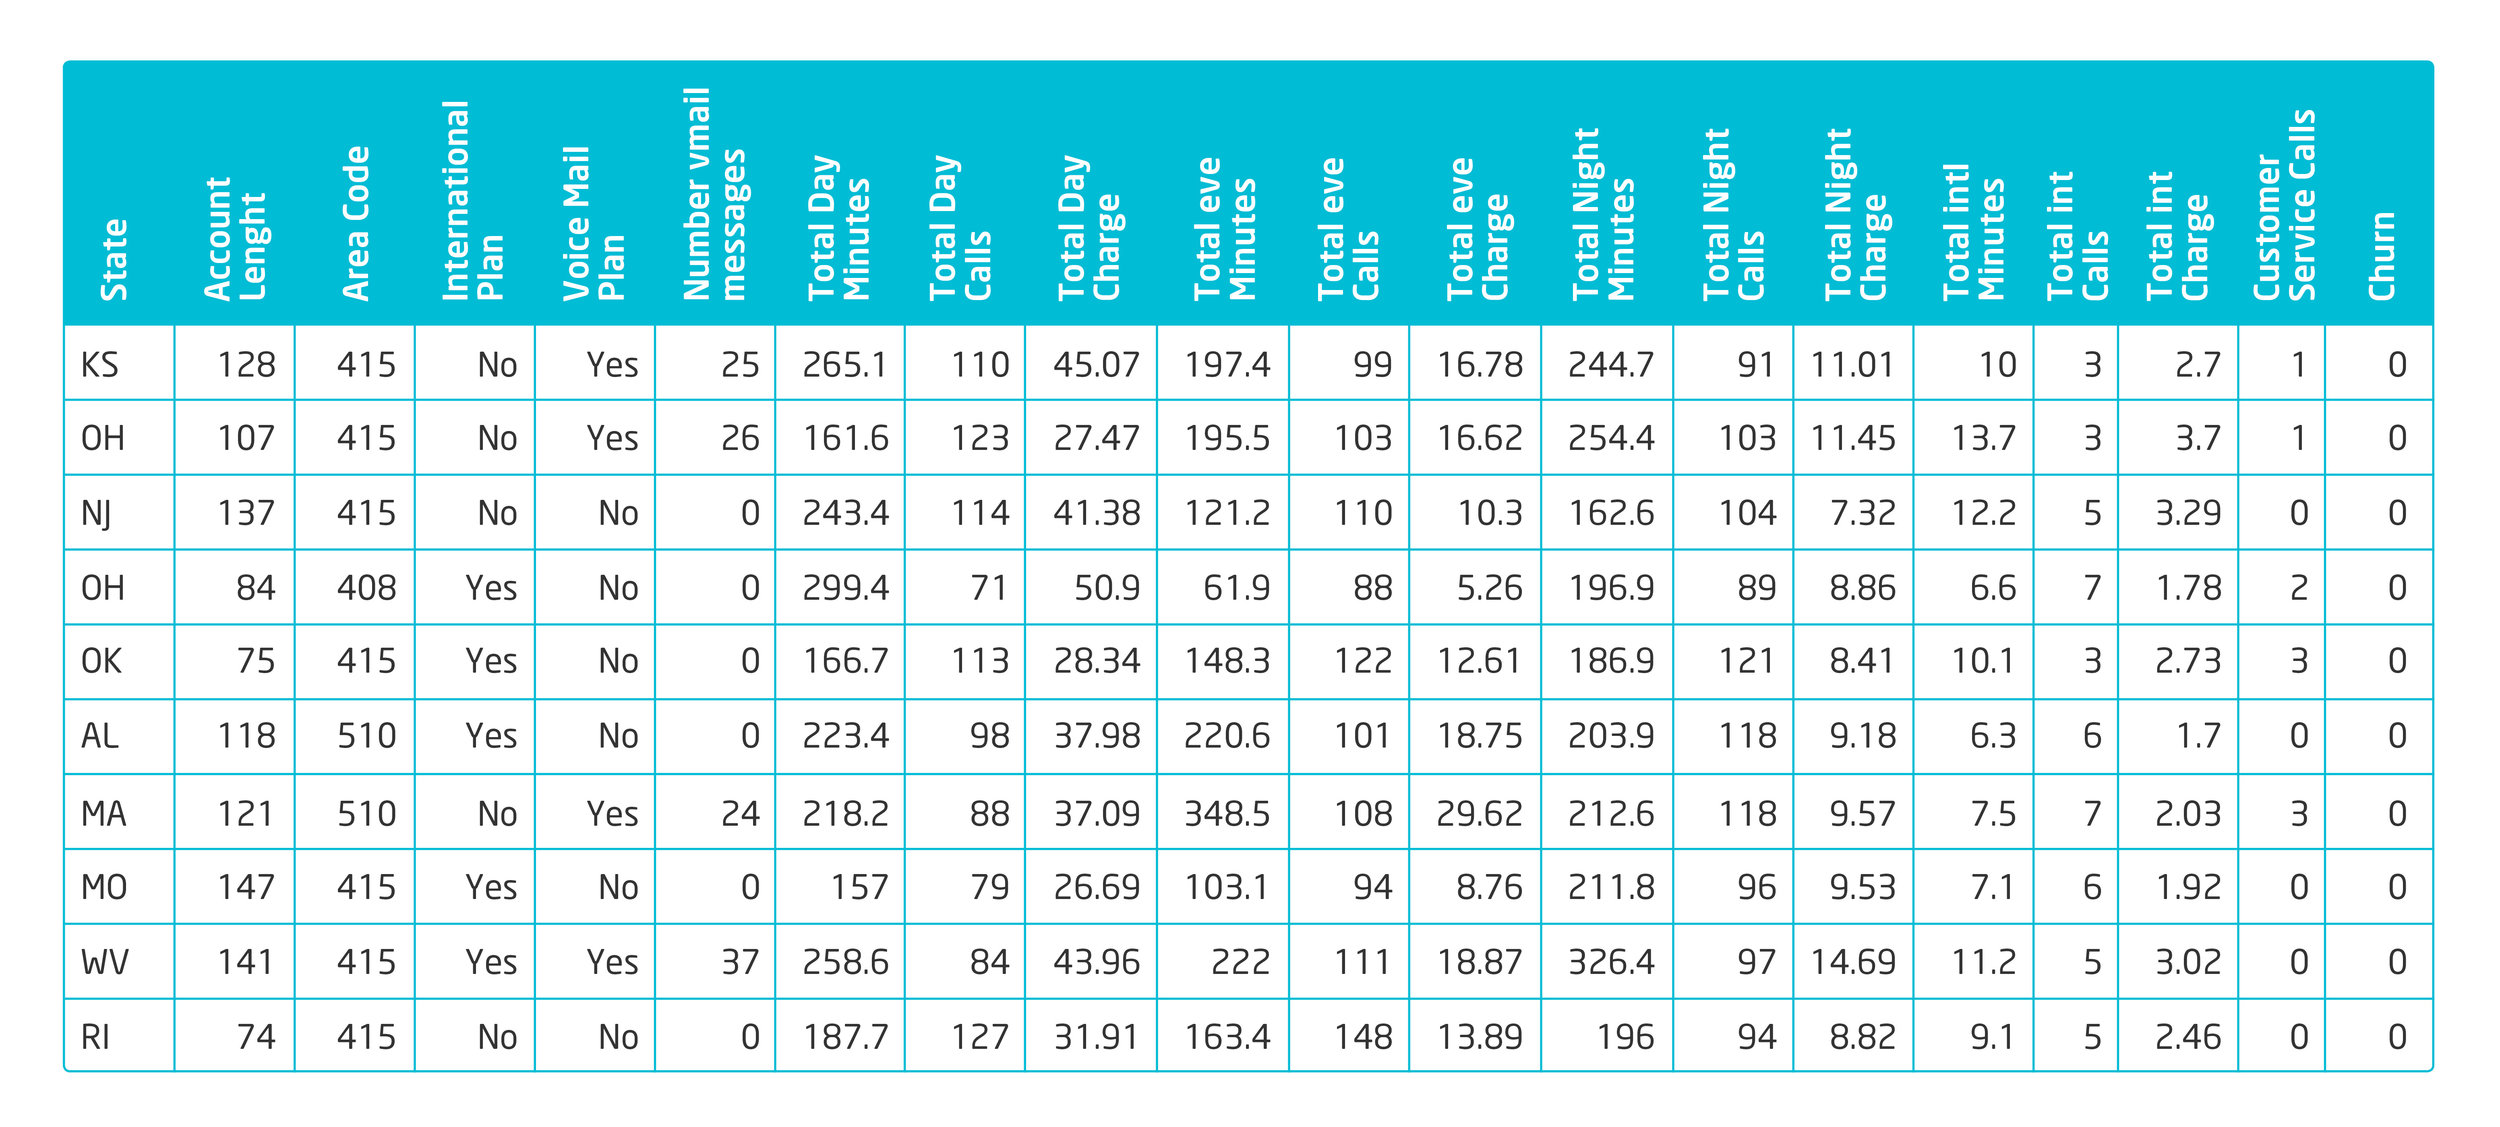
The image below represents a small sample of our dataset that we are using for our predictions.
We use SAP Predictive analytics to help us build our decision tree, to respond to the business question: how could we prevent churn from customers, based on our historical data?
Let’s see the outcome:
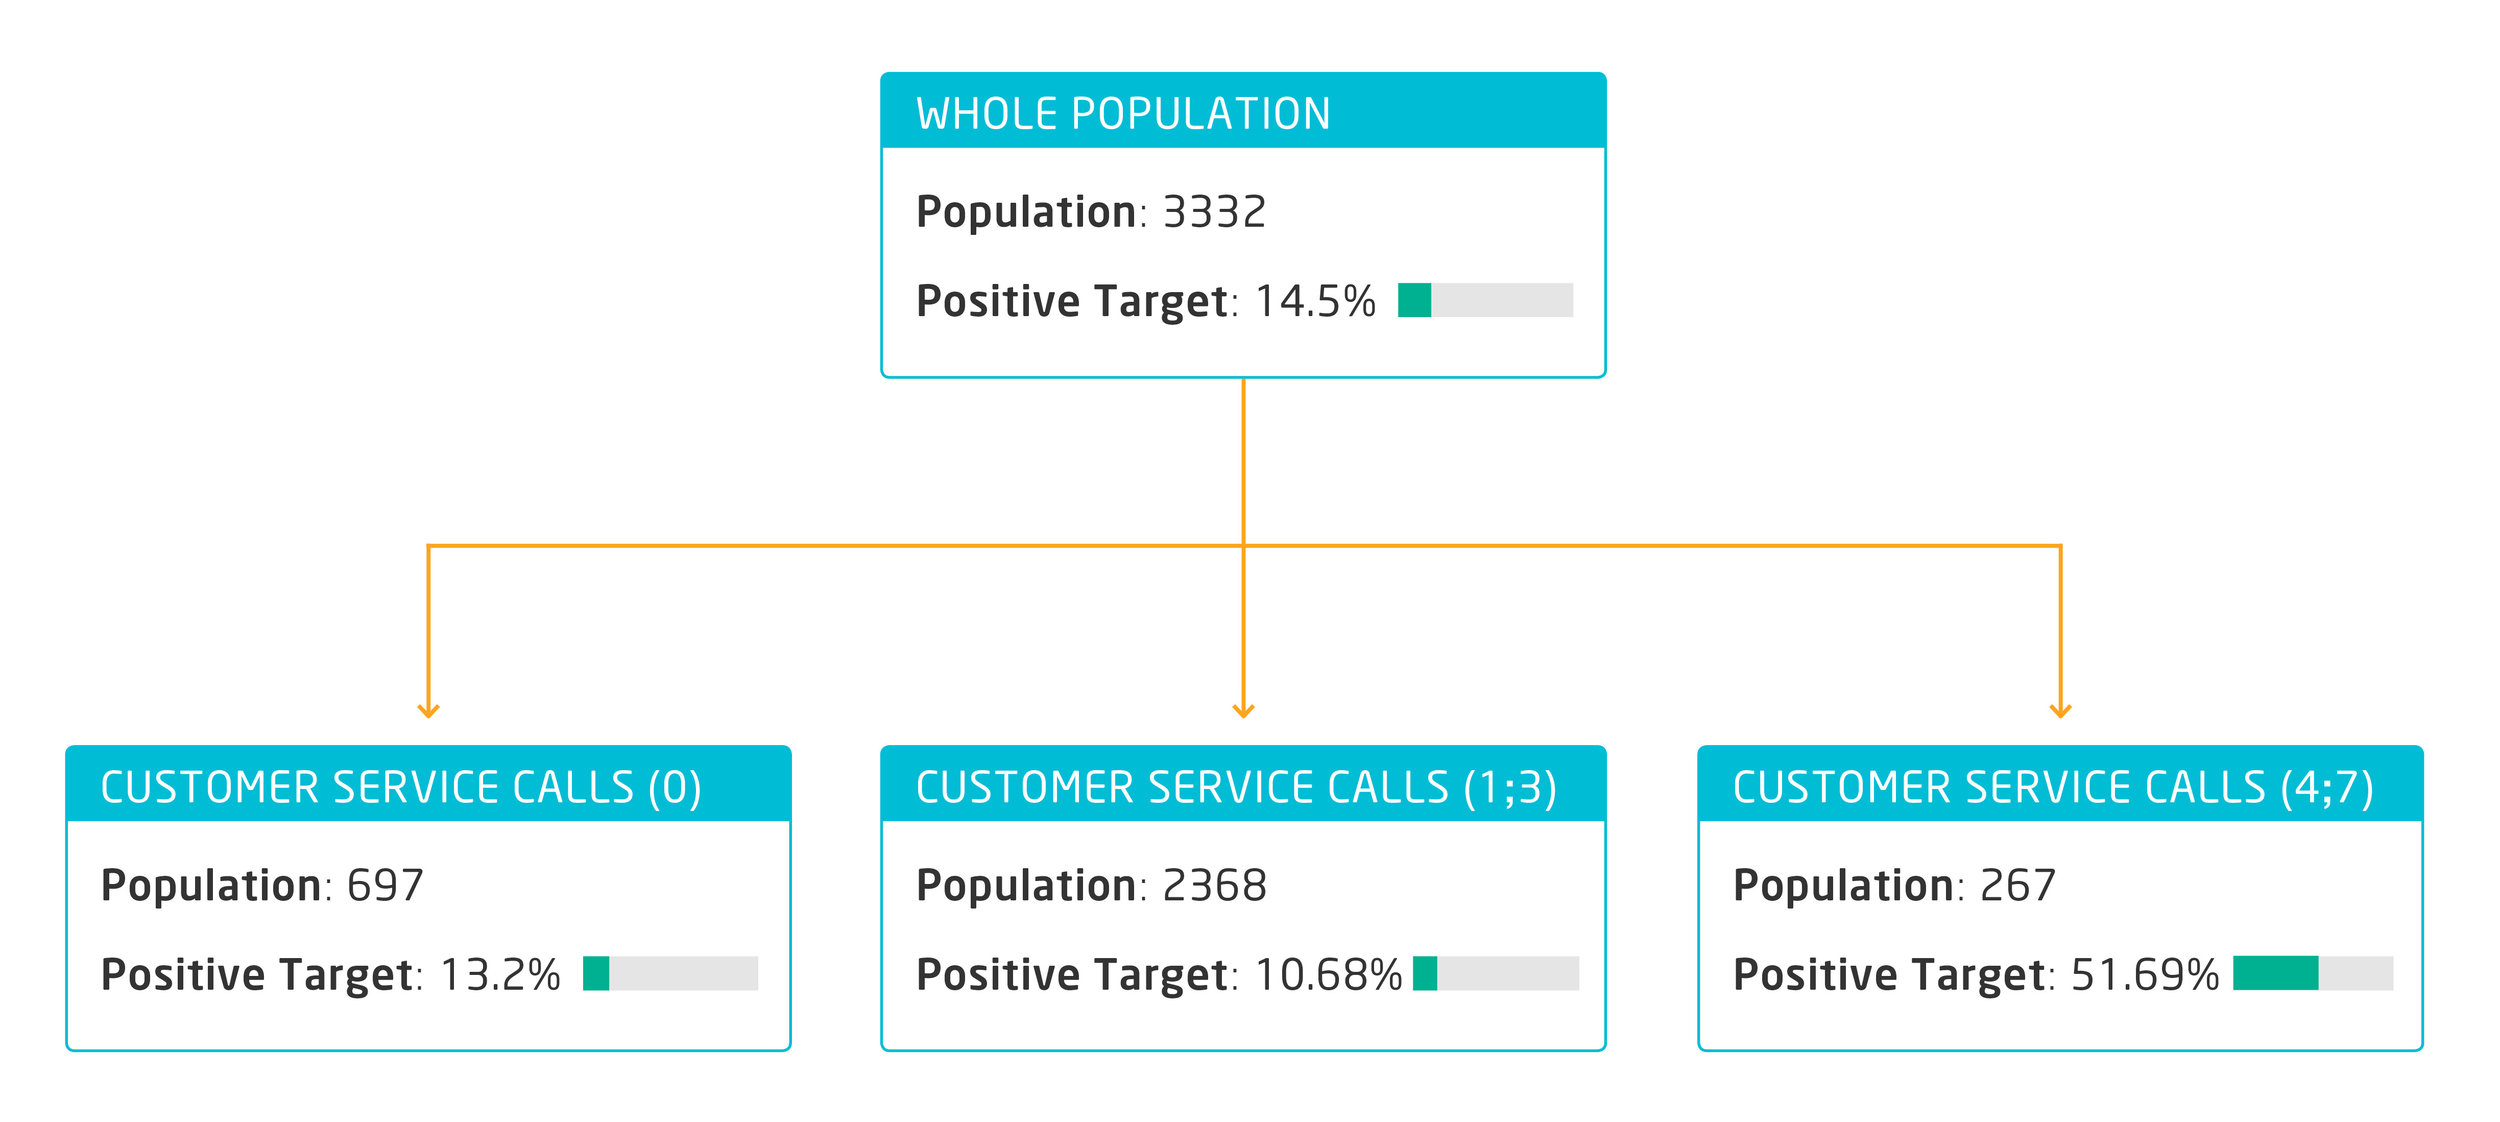
The tree starts with the analysis of the whole population, which is in our case 3332 customers. The first thing we notice is that over 14% of these customers have churned. The first variable the algorithm shows as decisive to predict churning is “customer service calls”. As we can see in the box at the right side on Fig 1, around 52% of clients who have called customer service more than 3 times end up churning. The company should act proactively, call those customers and try to listen to them and resolve their issues right after the 3rd call.
First prevention action: proactively call all customers right after the 3rd call received to customer service to try to resolve their issues.
Let’s continue analysing the tree:
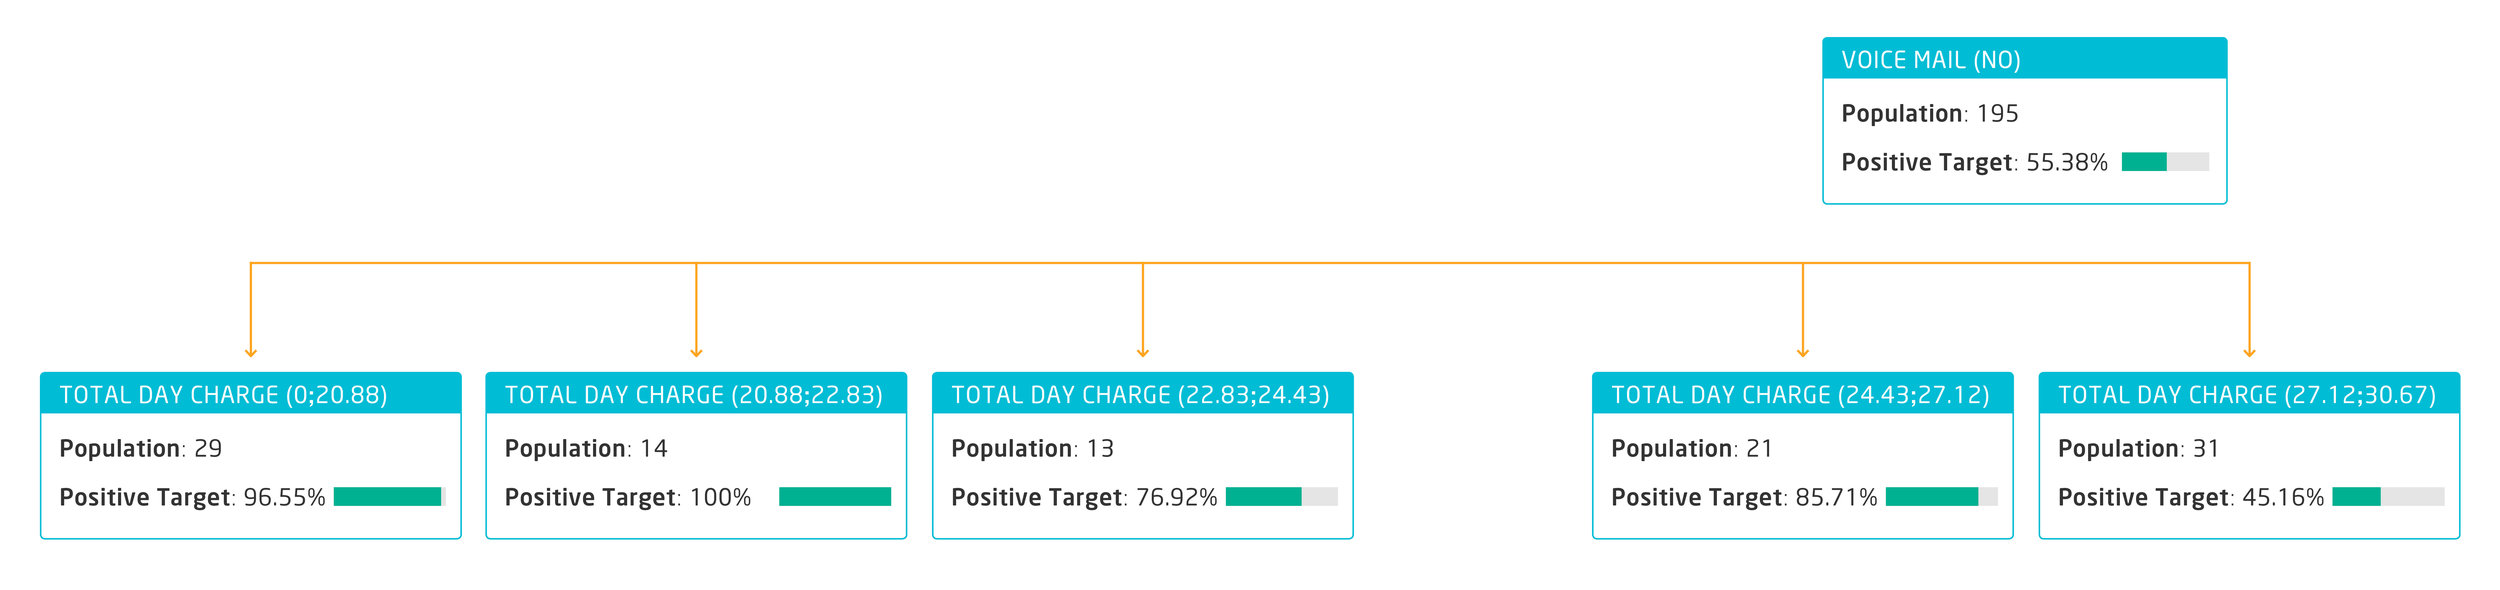
The next level is telling us there is a big correlation between not having a voicemail activated and churning, especially among customers with a low daily spending. We could assume that those users do not use their phones for work, so they receive a better service when they have an active voice mail service during the day, allowing them to catch up on missing calls and messages at the end of the day.
Second prevention action: start a campaign offering free voicemail activation, and proactively inform the most relevant customer segment (daily charge between 0 and 24.43$, monthly)
Finally, let’s analyse the bottom level of the tree by using “International Plan” as a branch separator:
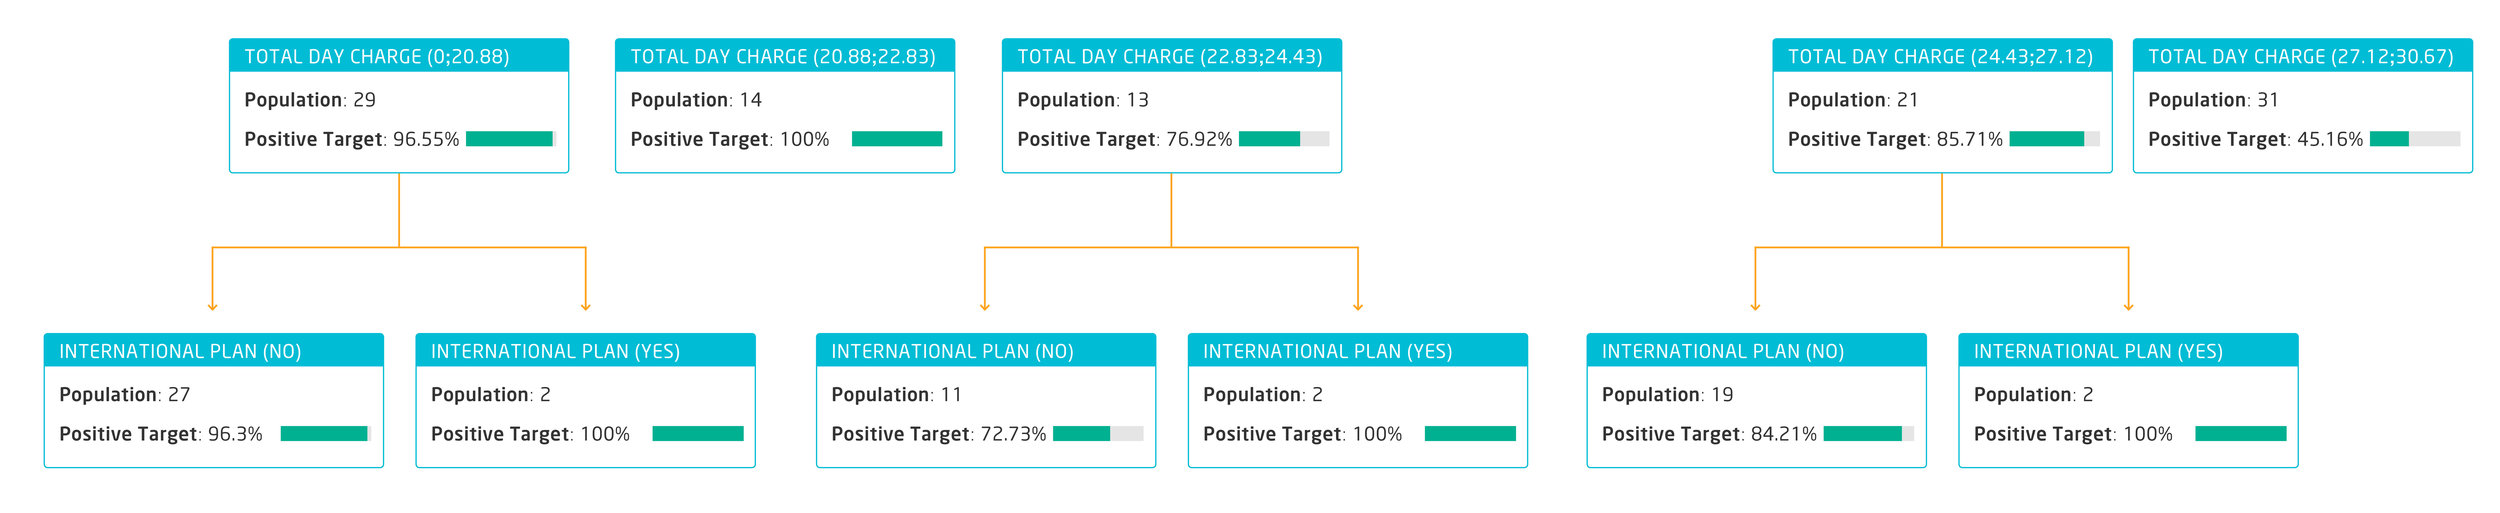
As we can see, the churning rate is higher among customers who have an international calls plan, no matter which combination the previous variables were. Clearly all customers having an international calls plan are unhappy and tend to churn more.
Third prevention action: review international plans and their adequateness to the usage and needs of each customer segment.
SUMMARY
Decision trees are an easy method of representing frequencies of attributes we suspect can provide insights, helping to predict an outcome. They can be very useful to analyse probable causes of good and bad business outcomes, and help us improve our service levels, increase customer retention or prevent fraud, among many other applications.
Most importantly, decision trees as many other ML algorithms are already available in many of the SAP BI solutions. Clariba can help you identify the Machine Learning processes that can add value to your business and integrate them in your existing BI ecosystem. Contact us and we’ll be delighted to support you in this journey.
REFERENCES
https://machinelearningmastery.com/classification-and-regression-trees-for-machine-learning/
https://towardsdatascience.com/types-of-machine-learning-algorithms-you-should-know-953a08248861