""

Technical

Implementing Materialized Views in Oracle - Execute queries faster

Let's assume that you've been convinced by Marc's excellent article about the aggregate awareness dilemma, and that after balancing all the arguments you've decided to implement the aggregates in your Oracle database. Two parts are necessary: the materialized views and the query rewrite mechanism.

What is a materialized view?

Think of it as a standard view: it's also based on a SELECT query. But while views are purely logical structures, materialized views are physically created, like tables. And like tables, you can create indexes on them. But the materialized views can be refreshed (automatically or manually, we'll see that later) against their definitions.

Let's imagine the following situation: a multinational company manages the financial accounts of its subsidiaries. For each period (year + month) and for each company, many thousands of records are saved in the data warehouse (with an account code and a MTD (month to date) value). You'll find below a very simplified schema of this data warehouse.

What happens when we want to have the sum of all accounts for each period?

Without a materialized view, all the rows have to be retrieved so that the sum can be calculated. In my case, the following query takes around 2 seconds on my test database. The explanation plan tells me that more than 1 million records had to be read in the first place.

(Query 1)

select p.year, p.month, sum(a.mtd)

from dim_period p

join account_balance a on a.period_key = p.period_key

group by p.year, p.month

So how do you avoid this reading of more than 1 million records? A solution is to maintain aggregate tables in your database. But it means a bigger ETL and a more complex Universe with @aggregate_aware functions. Although this could be a valid option, we've chosen to avoid that..

Another solution is to create a materialized view. The syntax can be quite simple:

(Query MV-1)

CREATE MATERIALIZED VIEW MV_PERIODS

BUILD IMMEDIATE

ENABLE QUERY REWRITE

AS

select p.year, p.month, sum(a.mtd)

from dim_period p

join account_balance a on a.period_key = p.period_key

group by p.year, p.month

Let's go through the query lines.

  • CREATE MATERIALIZED VIEW MV_PERIODS => We simply create the view and give it the name MV_PERIODS.
  • BUILD IMMEDIATE => The materialized view will be built now
  • ENABLE QUERY REWRITE => If we don't specify this, then the materialized view will be created and could be accessed directly, but it wouldn't be automatically used by the query rewriting mechanism.
  • The "as select…" is the same as the original query we made.

You'll notice when executing this query that the time needed to create this materialized view is at least the time needed to execute the sub-query (+ some time needed to physically write the rows in the database). In my case it was 2.5 seconds, slightly more than the original 2 seconds.

If now I re-execute my original query, I get the same result set as before, but instead of 2 seconds I now need 16 milliseconds. So it's now 120 times faster! Oracle understood it could automatically retrieve the results from the materialized view. So it only read this table instead of doing of full read of the fact table.


The data freshness

Now imagine a new month is gone, and new rows have arrived in your data warehouse. You re-execute your original select query and at your great surprise, it takes a lot of time: 2 seconds! But why?

It is possible to ask Oracle to tell us if a query was rewritten with a given materialized view, and if not to give us the reasons. Let's see a possible syntax below.

SET SERVEROUTPUT ON;

DECLARE

Rewrite_Array SYS.RewriteArrayType := SYS.RewriteArrayType();

querytxt VARCHAR2(4000) := '

select p.year, p.month, sum(a.mtd)

from dim_period p, account_balance a

where a.period_key = p.period_key

group by p.year, p.month

';

no_of_msgs NUMBER;

i NUMBER;

BEGIN

dbms_mview.Explain_Rewrite(querytxt, 'MV_PERIODS',  Rewrite_Array);

no_of_msgs := rewrite_array.count;

FOR i IN 1..no_of_msgs

LOOP

DBMS_OUTPUT.PUT_LINE('>> MV_NAME  : ' || Rewrite_Array(i).mv_name);

DBMS_OUTPUT.PUT_LINE('>> MESSAGE  : ' || Rewrite_Array(i).message);

END LOOP;

END;

(The sections in red indicate which parts of the query you can update; the rest should stay as is).

Once I executed these lines, I got the following result:

>> MV_NAME  : MV_PERIODS

>> MESSAGE  : QSM-01150: query did not rewrite

>> MV_NAME  : MV_PERIODS

>> MESSAGE  : QSM-01029: materialized view, MV_PERIODS, is stale in ENFORCED integrity mode

(Technical note: to see these lines in the Oracle SQL Developer, you need to activate the DBMS output: menu View / DBMS Output and then click on the button 'Enable DMBS Output for the connection)

The line "materialized view, MV_PERIODS, is stale in ENFORCED integrity mode" means that the materialized view is not used because it does not have the right data anymore. So to be able to use the query rewrite process once again, we need to refresh the view with the following syntax:

BEGIN DBMS_SNAPSHOT.REFRESH('MV_PERIODS','C'); end;

Note that in certain situations, the final users may prefer having the data from yesterday in 1 second rather than the data of today in 5 minutes. In that case, choose the STALE_TOLERATED integrity mode (rather than the ENFORCED default) and the query will be rewritten even if the data in the materialized view is not fresh anymore.


Extend your materialized views

Now let's imagine that we want to have not only the account sums by periods, but also by company code. Our new SQL query is the following:

(Query 2)

select p.year, p.month, c.company_code, sum(a.mtd)

from dim_period p, account_balance a, dim_company c

where a.period_key = p.period_key

and a.company_key = c.company_key

group by p.year, p.month, c.company_code

Of course the materialized view MV_PERIODS doesn't have the necessary information (company key or company code) and cannot be used to rewrite this query. So let's create another materialized view.

(Query MV-3)

CREATE MATERIALIZED VIEW MV_PERIODS_COMPANIES

BUILD IMMEDIATE

ENABLE QUERY REWRITE

AS

select p.year, p.month, c.company_code, sum(a.mtd)

from dim_period p, account_balance a, dim_company c

where a.period_key = p.period_key

and a.company_key = c.company_key

group by p.year, p.month, c.company_code

So now our query takes a very short time to complete. But what if, after having deleted the MV_PERIODS materialized view, you try to execute the first query (the one without the companies)? The query rewrite mechanism will work as well! Oracle will understand that it can use the content of MV_PERIOD_COMPANIES to calculate the sums quicker.

Be aware that the query will only rewrite if you had created a foreign key relationship between ACCOUNT_BALANCE.COMPANY_KEY and DIM_COMPANY.COMPANY_KEY. Otherwise you'll get the following message:

QSM-01284: materialized view MV_PERIODS_COMPANIES has an anchor table DIM_COMPANY not found in query.


Is basing the materialized view on the keys an option?

The materialized views we've created are very interesting but still a bit static. You may ask yourself: wouldn't have it been a better idea to base the materialized view on the keys? For example with the following syntax:

(Query MV-4)

CREATE MATERIALIZED VIEW MV_PERIODS_COMPANIES_keys

BUILD IMMEDIATE

ENABLE QUERY REWRITE

AS

select period_key, company_key, sum(mtd)

from account_balance

group by period_key, company_key

The answer is "it depends". On the good side, this allows for a greater flexibility, as you're not limited to some fields only (as in the query MV-1 where you're limited to year and month). On the bad side, as you're not using any join, the joins will have to be made during the run-time, which has an impact on the performance query (but even then, the query time will be much better than without materialized views).

So if you want a flexible solution because you don't know yet which are the fields that the users will need, it's probably better to use the keys. But if you already know the precise queries which will come (for example for pre-defined reports), it may be worth using the needed fields in the definition of the materialized view rather than the keys.

If you have any doubts or further information on this topic, please leave a comment below.

Attend the Clariba Webinar "Why Migrate to SAP BusinessObjects BI 4?"

Do you wish to know more about the reasons why to migrate to SAP BusinessObjects BI 4, the most advanced Business Intelligence platform?

Attend our Webinar on the 13th of March, from 11:00-12:00 CET (Presented in Spanish)

REGISTER HERE

SAP BusinessObjects BI 4 offers a complete set of functionalities that are key to today´s Business Intelligence market: an improved performance management, reports, search, analysis, data exploration and integration. This new version of SAP´s BI platform introduces several significant improvements to your BI environment.

With this in mind, Clariba invites you to invest an hour of your time to get to know the news and advantages of SAP BusinessObjects BI4, the most advanced BI solution will provide your company with a great number of functionalities designed to optimize performance and bring you a scalable and secure platform.

The agenda of our webinar is the following:

  • Welcoming and introduction
  • What is new in SAP BusinessObjects BI 4
  • Benefits of migrating to SAP BusinessObjects BI 4
  • Why migrate with Clariba
  • Questions and answers

For more information about SAP BusinessObjects BI 4, visit our website www.clariba.com

Best Regards,

Lorena Laborda Business Development Manager - Clariba


Atienda al Webinar ¿Porqué migrar a SAP BusinessObjects BI 4?


¿Desea conocer más acerca de los motivos para migrar a SAP BusinessObjects BI 4, la plataforma más avanzada de Business Intelligence?

Asista a nuestro Webinar el 13 de Marzo de 11.00 a 12:00 (CET)

REGISTRESE AQUÍ


SAP BusinessObjects BI 4 es la primera y única plataforma de Business Intelligence (BI) que proporciona un completo abanico de funcionalidades claves en el actual mercado de BI: una mejor gestión del rendimiento, informes, consultas y análisis, exploración de datos e integración. Esta nueva versión de la plataforma de SAP introduce avances significativos en su entorno de BI.

Con esto en mente, Clariba le invita a invertir una hora de su tiempo para conocer las novedades y ventajas de SAP BusinessObjects BI4, la más avanzada plataforma en el mercado de Business Intelligence, hará que su compañía se beneficie de un gran número de prestaciones diseñadas para optimizar su rendimiento, ofrecer una plataforma escalable y 100% segura.

La agenda para el webinar ¿Porqué migrar a SAP BusinessObjects BI 4? es la siguiente:

  • Introducción y bienvenida
  • Novedades en SAP BusinessObjects BI 4
  • Ventajas de Migrar a SAP BusinessObjects BI 4
  • Porque migrar con Clariba
  • Preguntas y respuestas

Para obtener más información acerca SAP BusinessObjects BI 4, visite nuestro sitio web www.clariba.com Saludos Cordiales,

Lorena Laborda Business Development Manager - Clariba

Attach a Dashboard Screenshot to an Email with one “click”

It is impressive how far we can get during a project if we try to meet all our customers’ requirements, including those that seem somewhat complicated to solve. During one of our projects in Middle East we received one of such requests. Our customer was asking us to build a functionality to send screenshots of their dashboard by email. Fair enough.

We immediately thought of installing some PDF creator free tool and tell them to print to pdf and then attach the document to the email but there were too many steps according to our customer. We needed to achieve this functionality with a single “click”.

Within a couple of hours and some emails sent to my colleagues Pierre-Emmanuel Larrouturou and Lluis Aspachs, we were then working on a solution meant to work with open source software and free tools that we found on google.

Below are the steps we followed to achieve the goal:

We created the exe file that makes the snapshot and attached it to an email

  • It looks for C:/Temp or D:/Temp folders to save the image
  • It looks for Outlook (Office 2003, 2007 or 2010) both in C:/ and D:/ Drive
  • We added the Xcelsius_burst.bat to skip the windows to authorize the launch of the exe
  • We saved the two files within C:/ Drive but it can be added also to D:. if the user creates a dedicated folder only the .bat file needs to be edited
  • We added the bat file path to a URL button in Xcelsius and run it

Notes: please check your browser options to avoid the bat popups if they are a problem. This version only works if installed within each customer machine. If you want to install it into a server (to avoid the multiple installations) you can create a more complex solution using the Pstools available for free in the network and adding it to your web server (in our case it was tomcat).


You can download the files by clicking on the link below. This solution is quite simple but it made our customer quite happy.

Dashboard Burst


Just to add more value to the article, there is another way to crack this issue: we are also adding below the latest version of the feature Dashboard_by_email.exe, which allows any screenshot (not only from Dashboards) to be automatically attached to emails. The program needs to run at windows startup and the user can get the screenshot directly attached to his/her email by pressing CTRL+ALT+D. Click on the link below to download.

Dashboard by email


We are also aware that the market is now offering add-ons for Dashboard Design which can also meet this and other requirements. You can check out what our friends at Data Savvy Tools (http://datasavvytools.com/) created for dashboard printing. We have tested their component that allows the selection of dashboard components to be printed out (and it´s great).

Let us know your comments and we will be more than happy to discuss these solutions with you.


SAP Universe Designer Tricks and Tips: Table Mapping

You know everything there possibly is to know about SAP Universe Designer right? Well, I bet that there´s still a trick or two you can discover. For example, there is one function not frequently used in Universe Designer called Table Mapping. This option was originally included in Universe Designer to protect some data to be seen by Developers (the developers´ user group sees the data from a different table than the Business users).

In this article we are going to show how to implement this table mapping feature for the use that it was meant for and we will then apply it in a couple of real life scenarios to provide developers with a simple and effective solution that minimizes the maintenance on their systems.

In order to create a replacement rule, follow the steps below

1. Go to Tools – Manage Security – Manage Access Restriction.

Picture1
Picture1

2. Click New to create the new restriction

Picture2
Picture2

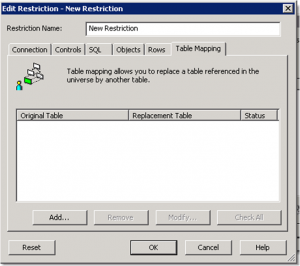
3. Go to Table Mapping and click Add to create the new rule

Picture3
Picture3

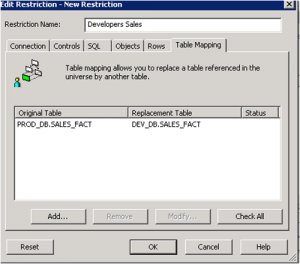
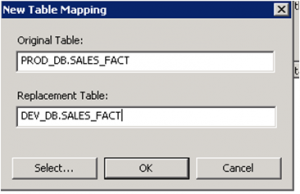
4. Fill in the tables you want to replace. In this case, we want the developers to see the data from the table SALES_FACT of the schema DEV_DB instead of PROD_DB (where we are storing the production data).

Picture4
Picture4

5. Click ok, fill in the name for the rule (In this case Developers Sales) and click ok

Picture5
Picture5

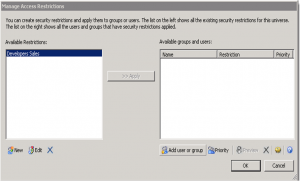
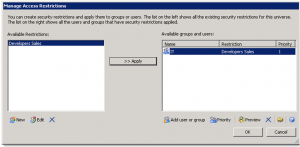
6. To apply this rule only to the user group “Developers”, click on “Add user and group”

Picture6
Picture6

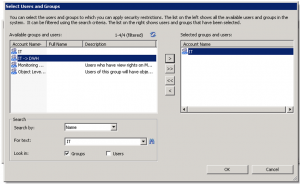
7. Select the group IT, and click Ok

Picture7
Picture7

8. Apply the rule to the IT group

Picture8
Picture8

Once we have published the universe, all the reports will change the SQL code automatically between the tables DEV_DB.SALES_FACT and PROD_DB.SALES_FACT depending on the user that is logged into the system.

One important point to take into consideration is the priority of the rules: In case of conflict, the restriction with the highest priority – lowest priority index –  lowest priority number will apply.

The example we reviewed above (dynamic change between developers and business user tables) is the most typical use for this functionality. However, there are some other scenarios where the table replacement could be very useful:

Scenario 1: We are reloading data on a production table. Previously, we have created a copy of the old data in a temporary table that we want to use for reporting while the reloading has not finished.

Solution: We can add a new rule to replace the original table for the temporary one, and apply it to the group “Everyone”. As soon as the reload is completed we can delete the rule. This process is much faster than renaming the table on the universe and to change all the objects that the universe is using on this table.

Scenario 2: We have different fact tables for different departments with the same or similar table structure and  all the dimension tables are common. We are looking for the best solution that reduces future maintenance.

Solution: Instead of creating different copies of the same universe by changing the fact table, we can create one universe and use the table replacement functionality to dynamically switch the fact table depending on the user functional group (in this case would be the department) that the user belongs to.

As we have seen in these examples this table mapping feature provides the developers with simplicity, effectiveness and maintenance reduction on their systems.

If you have any questions do not hesitate to leave a comment below.

Xcelsius in BI on Demand (BIOD)

In this blog article I am going to talk about Xcelsius in SAP BI On Demand (BIOD). What I am going to explain are the steps that you should follow to upload an existing Xcelsius Dashboard to the BIOD system. 

What is BIOD?

First of all, for those who don’t know what is BIOD I will give a brief explanation. Basically we can say that BIOD is the most complete and approachable cloud based business intelligence suite available in the market today. BIOD is software as a service; you do not need to install any software on your machines to get instant value from the system. All you need to do is Log in and provide some data. It is a cheap BI solution, due to the fact that you don’t need to make a huge investment in hardware, licenses, etc... everything is in the net.  The target for this technology is small companies, which are less likely to be able to acquire a BI system due to the costs, but with BIOD they have an accesible  way into SAP BusinessObjects analysis system. In BIOD you are able to create:

  • Xcelisus Dashboards
  • Web Intelligente reports
  • Explorer

You can get more information about BI On Demand here.

 Now, let´s see how to upload an existing XCelsius Dashboard to the BIOD system.

How to upload an Xcelsius Dashboard to BIOD?

First of all, if you don’t have a BIOD account you should create it. It s free, and with it you will able to test most of the features of this cloud system. Click here to Sign up.

Once we are logged, we will see this screen.

Now I want to show you how you should upload an existing Xcelsius file with static data to the BIOD system.

First of all we should create the DataSource, so in my Stuff panel we should select Datasets. After that we click Add New Button  -> Add Dataset

Then we should chose from which place we will select the dataset. We have several options: Create From Query (this option is only available in the BIOD Advanced version, where the connection to a universe is possible), bring data from salesforce or create an empty dataset from scratch and finally, we can upload a file (xls,xlsx or csv) which we will use in this example.

As I said before, we select an excel file as source of our dataset, in the first row of our excel file it is important to have the labels of each column. We can also edit this dataset, change the value type of each column, the label name, etc...

At the bottom of this page we can find the properties section, here we should enable the Web service. Once we have done this, the system will generate a url that will be the reference to the dataset in our dashboard.

The next step will be to upload the Xcelsius file as a template, so we select Add New -> Add Template.

We create a name for this template, uncheck the Create a new Xcelsius file check box and finally, select the xlf file that we have locally.

The screen below will then appear. In order to connect the dataset to our xlf file we should select the blue sentence (you may click here to edit the Xcelsius file). You can also attach an image of the dashboard as a thumbail for repository. The object selection will be fancier.

Once the Xcelsius editor is opened we add a connection using OnDemand -> Add Connection menu option. This will create one Flash Variables connection ([Flashvar]) and two Web Service Connections ([OD_Data1 and OD_Data2). In our case we should delete one data connection because we only have one source, but in case we need more data sources we can create as many as we want. It will also create a new tab in the XC spreadsheet that contains these cell bindings.

After that we configure the data connections. Open the Data Manager (Data -> Connections) and you will see a Connection of type FlashVars.  You should see the following:

  • get_data_url: (mandatory). This should be bound to the cell which the Web Service Url of the Web Service Connections are also bound to. If you have multiple connections this should be bound to the range which holds those connections.

Then each Web Service Connection (OD_DataN), in our case only OD_Data1 points to the set of cells to which that connection outputs its data.

These are the next steps that you should follow in order to setup the dashboard:

  • Click on My Datasets and click copy beside the dataset OD_Data1.
  • Paste the url from dataset to the WSDL URL input box of a Web Service connection

  • Click Import to import the schema.
  • Bind the web service url to the same cell as get data url (Note: if you used the Add Connection process this should already be done).
  • Bind the headers and the row values.
  • Set Refresh on Load to be true.

After these steps you can save your changes and then click the Back button to go back to Edit Connection step of creating a template. You should see your connection listed on the screen.

Click Next to go to the Edit Sample Data step, you can choose to add in your sample data from the XLF if you like, and then click Finish.

Finally we will create a visualization using this template. We select our Data Input, in this case Data Source.


If we go to the visualization menu we can find the object.


In conclusion we can say that the BIOD system is a nice tool to start testing the power of the SAP solutions without a potential heavy investment at the beginning. It can be also a good tool to make demos on and show our dashboards to customers. It is very interesting to test the explorer tool, you can see the amount of options that the BIOD brings you in terms of data analysis.  If you are interested in the advanced solution you should get in touch with SAP.

If you have any comment or doubts do not hesitate to contact us or leave a comment below.

Tackling the Aggregate Awareness Dilemma

In my last project I faced a situation where the customer asked me about the best option for a particular topic and this time my answer had to be "it depends". As a consultant, my duty was to provide two different options (with their corresponding pros and cons) but I could not make a decision on this, since the answer was highly dependent on the composition of IT service providers in different areas and also their road map. In general BI terms, we could define aggregation as the process of summarizing information at a certain level of detail in order to improve the performance. The Kimball Group defines Aggregate Navigation as the ability to use the right aggregated information and recommends to design an architecture with services that hide this complexity from the end user. In the BusinessObjects world the same concept is called Aggregate Awareness and the database administrators community usually refers to it as query re-write.

In SAP BusinessObjects, this can be achieved through the use of the function @aggregate_aware, contexts and incompatible objects in universe designer. At a database level (RDBMS), certain vendors provide this feature through Materialized Views with query re-write option (Oracle, Sybase, DB2, Informix, PostgreSQL and some others).

So here we have the dilemma: where to place this logic in a customer environment: in the physical layer or in the logical layer?

Both options are valid, but there are some considerations that need to be taken into account from different points of view:

Table Comparison

The information seen in the table above can already be interpreted, but as a summary, my recommendation would be:

Implementing Aggregate Awareness in SAP Business Objects:

  • Ideal for an architecture with many database sources (not all database sources support the query re-write feature and it needs to be maintained in each of them)
  • Good to have if the database vendor may be changed in the future (no changes needed in the universe)
  • No access to strong Database Administrators that can properly tune the database
  • Closed reporting architecture relying on a strong semantic layer in Business Objects
  • There is a need for a centralized metadata repository

Implementing query re-write mechanisms in the RDBMS:

  • Ideal for an architecture with many reporting tools accessing the same database
  • Access to strong Database Administrators
  • It simplifies universe design
  • There is no need for a centralized data repository

If after reading this post you still have doubts on what direction to go for at your company or customer, do not hesitate to contact clariba at info@clariba.com or leave a comment below.

SAP BusinessObjects Mobility Solutions (Part 2 - SAP BI Mobile)

This is the second article of the SAP Mobility Solution series.  It is time to review the second Mobile application that has been release by SAP Business Objects: SAP BI Mobile

If you have not  read the first article on SAP Explorer yet, check it out.

Just as a brief reminder that both this and the previous tool can be downloaded (if you are an SAP partner) through SAP Marketplace

If you are not an SAP partner but still feel like trying these tools you can still download the mobile applications from the app store and try out the demo servers SAP has made available.

Now let’s start reviewing the second Mobile tool from SAP Business Objects

SAP BI Mobile

The SAP BI Mobile application allows WebI and Crystal reports to be displayed and distributed through Mobile devices. The application we will review here is the Ipad version but other mobile devices are also supported. The Ipad version of this application can only be installed if you have Business Objects XI 3.1 SP3 or higher, so be prepared to patch your system if it is not at this level.

Click Here to find a complete overview of this application.

The first step to get this application running is to install the server side of the software. To do so you need to download two files from the SAP Marketplace: the BI Mobile 3.1 SP3 file and also the BI Mobile SP4 (required for Ipad support)

Installation

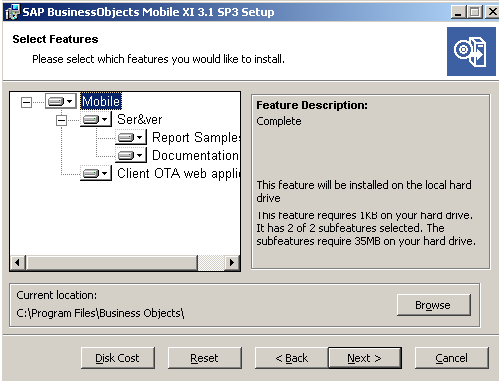
The installation is also straightforward and you should only modify the default settings of the install if your Business Objects system configuration requires it.

For example, if you have a web server separated from the application server then you will have to install those two sides separately (Custom Install). In our example, since all the components are on the same machine we will install all the software on the same place (Complete Install).

You can see in the screen below how components are separated in the install process.

Once you run through the install for the BI Mobile SP3, you will also need to install SP4. This patch installation does not require any configuration and will only write the patched files on the home business objects directory.

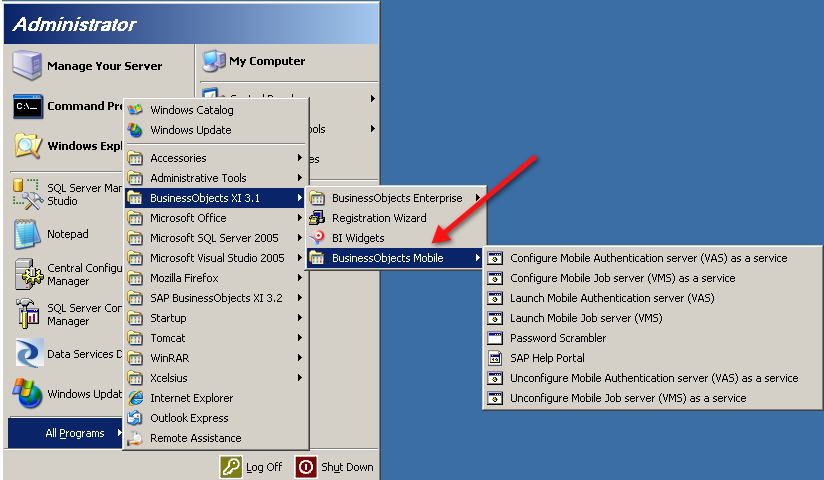
After these two installations are complete you will notice new applications are installed on the server components of you Business Objects system.

Run both of the Configure as a service options (only on windows install) so you can also have the BI Mobile components available as services under windows.

Make sure your new Mobile services are started and remember to set them to start automatically in case they need to remain ON along with the Business Objects system.

Deploying Web Components

The web part of the BI Mobile application has also been generated during installation but for some reason they are not automatically deployed (at least in our test cases). Therefore you will need to move them yourself to the Tomcat webapps directory so they are deployed.

Browse to the following directory: $BOBJ_Home/Business Objects 12.0/java/

Locate the following files:

  • MobileBIService.war
  • MobileOTA.war
  • MOBIServer.war

Copy these files to the webapps directory located at: $BOBJ_Home/Tomcat55/webapps

When the .war files are copied to this directory they will be automatically picked up by Tomcat and new directory apps will be created. If the deployment is successful you should be able to access the Mobile default web page at:

http://yourserver:8080/MobileOTA

If a webpage comes on with options for different mobile devices, we are now ready to install/configure the mobile application on the ipad.

The Mobile Application

First off, we need to download the application from the App Store. You would find it under the name SAP BI Mobile (do not confuse with Mobile One app)

Once downloaded, it is time to configure the settings for a new Mobile connection.  Start the app on the Ipad and click on the Settings option at the bottom.

Select the "add a connection" option where you will have to provide the following:

  • Connection Name
  • Server URL. This is the name:port of the machine where the BI Mobile web component has been installed (without http in front)
  • The CMS name that controls the BI Mobile server components
  • The Authentication method
  • Username and Password

Save the configuration and select the newly created connection.

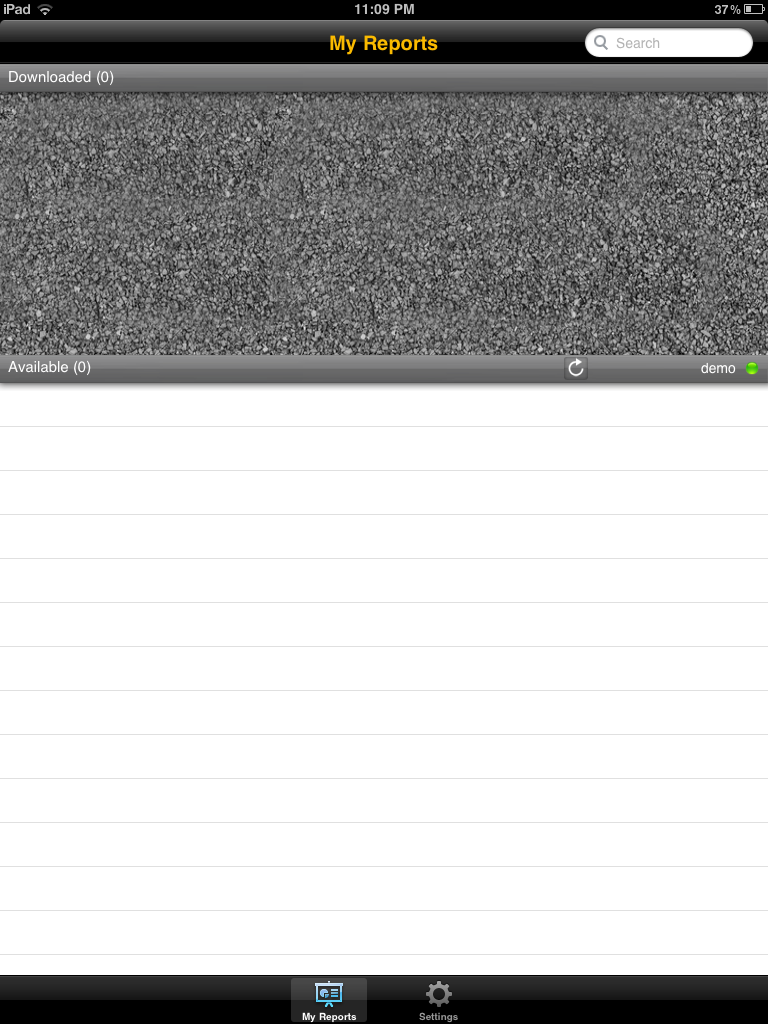
If the connection is successful we will face the following screen on the Ipad application.

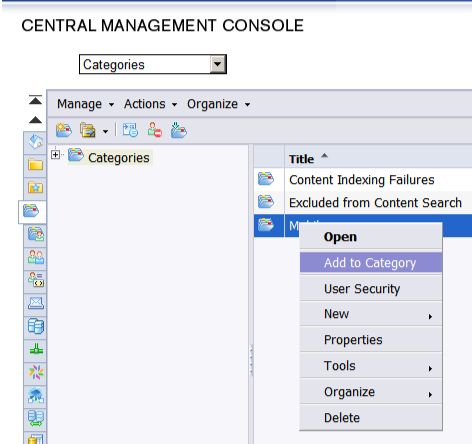
The connection to the mobile server has been successful but we have no reports to show yet. To make new reports available to the mobile application we will have to tag them as mobile compatible. This is done by adding the reports to a category called Mobile. This category can be customized as desired but for this example we will use the default value.

Select the reports we want to make available on the BI Mobile application and categorize them as Mobile.

NOTE: In most cases the category does not previously exist and you might need to create it prior to this step.

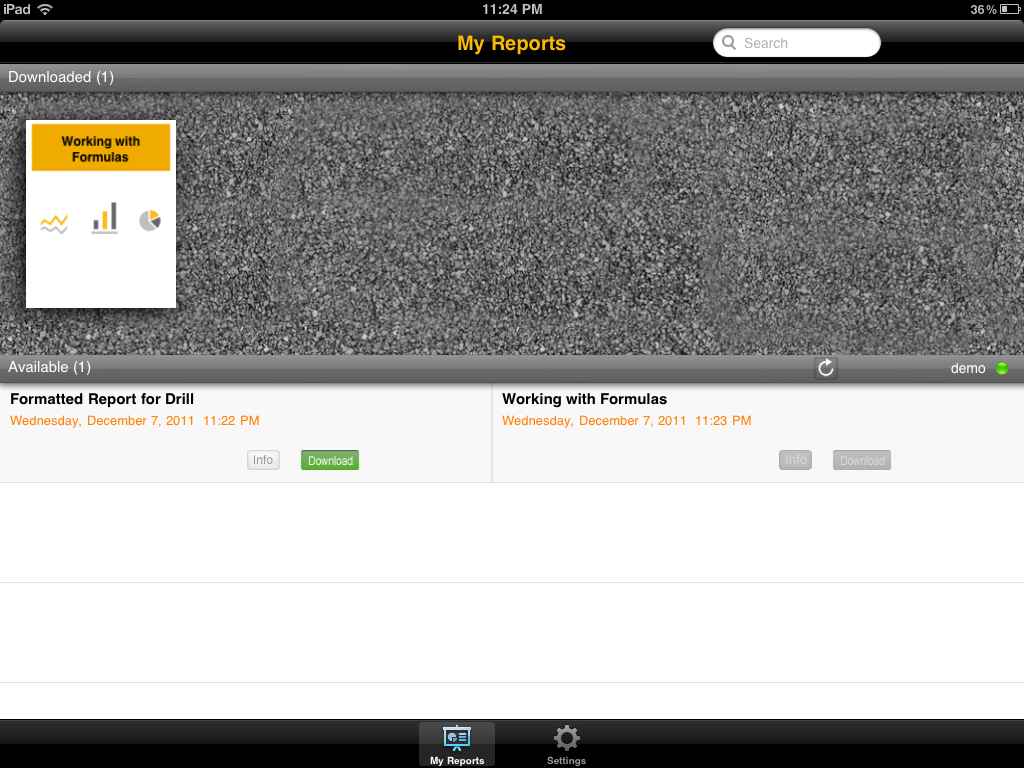
Almost immediately after this is done, you will see the categorized reports appear on the lower part of the BI Mobile application.  The reports are now ready to be downloaded to the Ipad.

Click on the green download button that appears next to each report.

When the download is completed the downloaded report will appear on the upper part of the BI Mobile application. We can now click on the report on the upper part and you will find the Mobile version of your WebI/Crystal report.

Be aware that not all WebI capabilities are supported by the BI Mobile version. To understand the limitations you can review the product guide here

On the same document we can also find some useful best practices on how to design a WebI/Crystal report for Mobile viewing and templates that can help you when designing new reports according to mobile devices´ size.

Although the variety of graphs and interaction in the BI Mobile application is still quite basic, we think SAP is in definitely on the right track.

Appendix on Business Objects XI 4.0

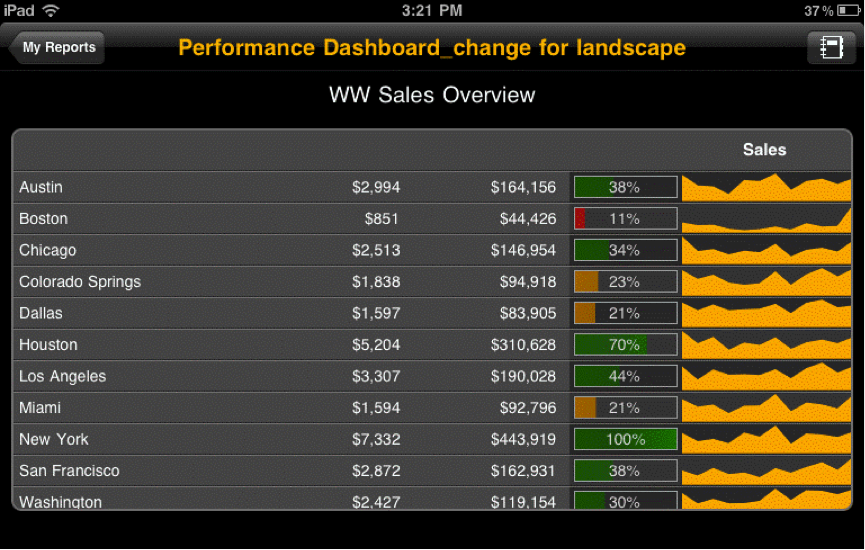
Although our example reviews version 3.1 of the Mobile application we also advise to review the guide for release 4.0 as it contains additional features on the BI Mobile application. The additional features include in-table graphics such as percentage bars or sparkline trends. See screenshot below:


Conclusion on SAP BusinessObjects Mobility Solutions

This is a promising start. Chances are that  soon SAP will extend the devices covered, support more complex graphs and take better advantage of the Ipad interaction capabilities as well.

With mobile solutions you will be able to optimize your existing investment by bringing your content to more mediums, you will be able to provide instant answers to more people, no matter where they are working from, therefore, you will boost the performace of your organization. All bets are on mobility!


If you are interested or have worked with this application, or if you feel it might be useful in your organization, please leave a comment below.
StreamWork – the Collaborative Work Environment from SAP

We are noticing that our customers and potential customers are starting to look for collaborative models and workflows. The reason is that they want to foster and improve teamwork and reduce human errors by creating approval flows for their internal tasks. So, if yesterday the power users or IT could directly modify the values of a database without any control, today, with an increasing number of employees and a growing level of complexity for processes, they prefer formal workflows to drive efficiency and always ensure the approval of the management, a collaborative model that can reduce or even eliminate errors coming from lack of control on actions.

SAP does not yet have any workflow engine (or at least we are not aware of it), but we have what SAP calls “Social Intelligence” tool, which is called StreamWork.

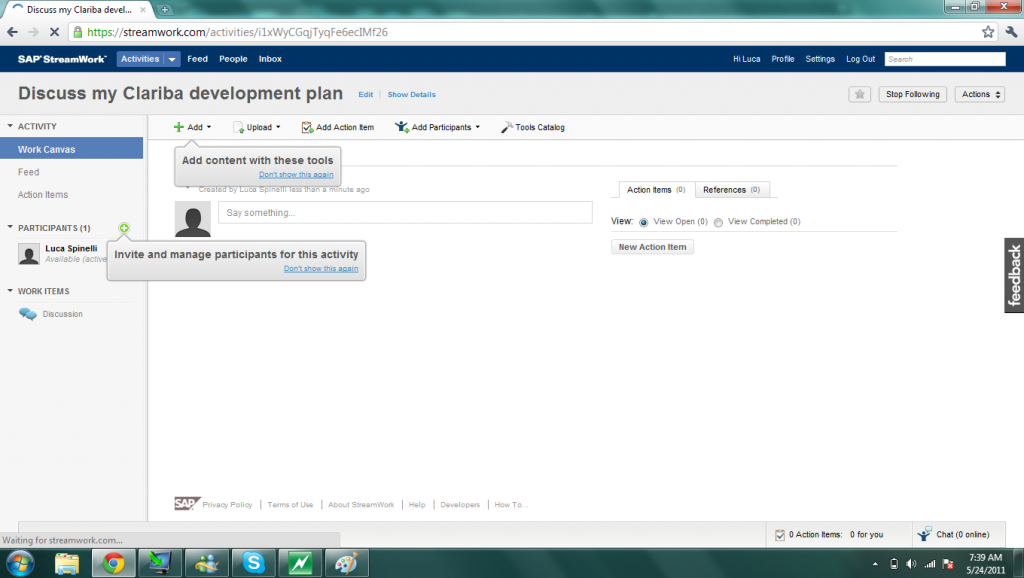
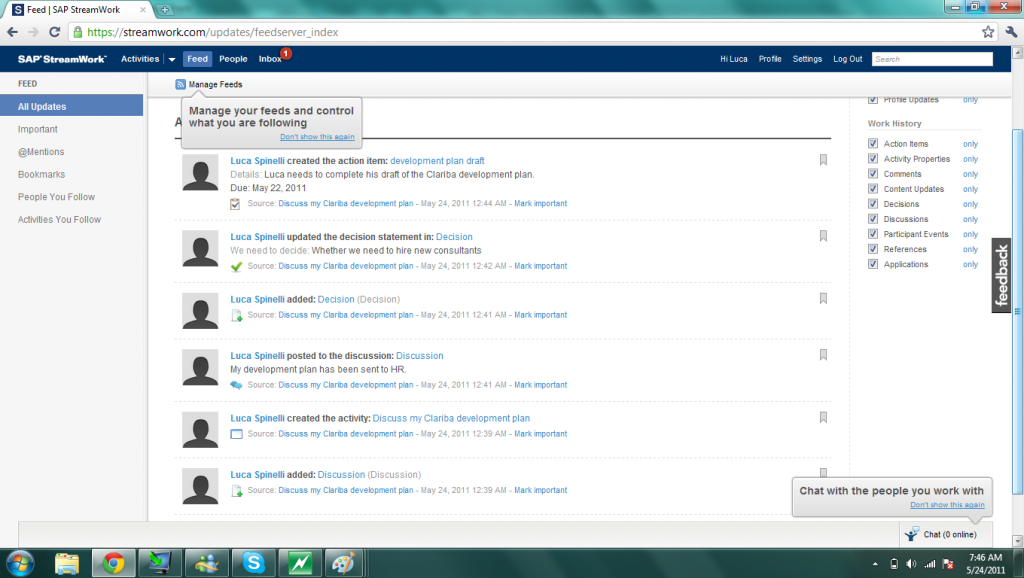
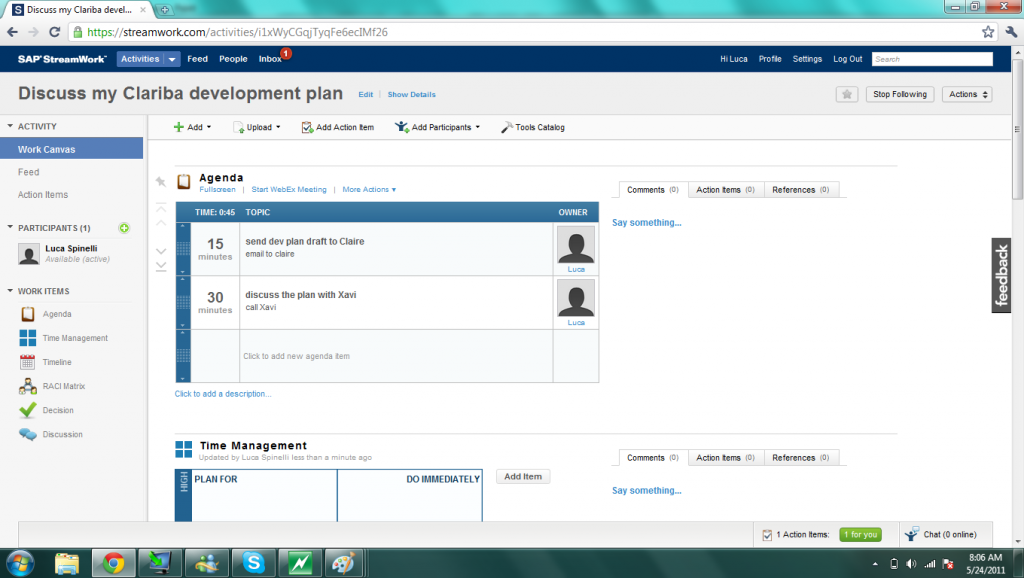
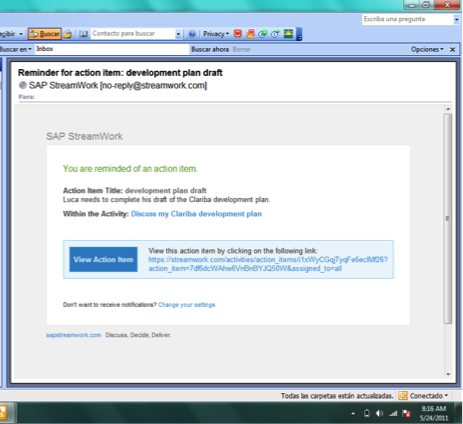
This solution looks like a mix between Facebook, Twitter, LinkedIn and MS Outlook/Projects. I have taken some print screen images during the tests I have done in one of our clients, so you can see what is available:


Users can create tasks/activities and add participants;


Add actions to different tasks;


Manage feeds and control what they are following;


Set agendas and RACI matrices;


Define notification settings and get email reminders on their inbox…


…in a few words: they can collaborate while they work on a project.

If you want to access a free version of StreamWork, please go to www.streamwork.com and sign in. Moreover, you can find a white paper attached sap_streamwork, where you can read what SAP says about it. In my opinion, a very interesting tool, worth checking it out.

How to search faster and more efficiently with Firefox (and Chrome/Opera)

Implementing technologies in environments that are always changing often generates doubts and challenges for us consultants. Of course you can ask your colleagues, but they are not always free and sometimes they just don't know the answer.  So most of the time we are relying on the Internet to find tutorials or people who met the same problems before and explain how they have solved them. Therefore being able to search fast and efficiently makes our lives easier. Fortunately, some of the modern browsers (who said IE6?) give us this possibility. I will now give three main tips to improve the way you search the internet - if you don't have much time, jump directly to the 3rd tip, which is the most effective one.

This article focuses on Firefox, but alternative browsers are mentioned as well.

Tip n°1: add search engines to your browser (Firefox, Internet Explorer, Chrome, Opera and Safari).

On Firefox you can see the search engine box on the top-right corner of your window.

If you click on the symbol on the left (here the Google icon), you will see a list of all the search engines you have already installed, plus an option to manage search engines. One of the best options available to look for new search engines (at least for Firefox, IE and Chrome) is the Mycroft project: http://mycroft.mozdev.org/

For example, if we search what are the search engines corresponding to SAP, then we find (unter section 6. Computer) the following:

Just click on one of them, and confirm that you want to use it as a new search engine.

You can now do searches based on this search engine.

Tip n°2: assign keywords to your search engines (Firefox, Chrome and Opera).

Assigning keywords to your search engines is quite easy. Open the "Manage Search Engine List" window, select the search engine of your choice, click on "Edit Keyword..." and just enter a keyword - and it is better if you make it short, for example "g" for Google and "w" for Wikipedia.

Once you've done this, you do not need to manually select the search engine anymore! Go to the address bar (remember the Ctrl+L shortcut), and simply type the keyword for the chosen search engine, followed by the searched term. Example: "g rapid mart" if you want to look for rapid marts on Google, or "w SAP" if you want to look at the SAP Wikipedia page.

Tip n°3: use bookmarks with the %s variable (Firefox, Chrome and Opera)

The search engines feature has many advantages, but also some clear limitations.

The most obvious is that not every website has an associated search engine, like for example the very useful Business Objects Board.

The second limitation is due to the nature of search engines - they're rather browser-specific, and the process of backing them up / restoring them is not always straightforward.

Fortunately, there is an even better solution which combines all the advantages of the search engines with the flexibility of the bookmarks. The solution simply consists in using "%s" in the URL of a bookmark.

Let's take a simple example: you are often using the excellent WordReference.com to translate from English to Italian and backwards. If you open the website, type the word "printer", choose "English-Italian" and press Enter, you get on the page "http://www.wordreference.com/enit/printer". Now create a new bookmark, but replace the "printer" in the URL with "%s". You end up having a new URL "http://www.wordreference.com/enit/%s". Assign a keyword to this bookmark - for example en_it. Now if you type "en_it printer" in your address bar (once again remember Ctrl+L), you are taken to the same page.

The huge advantage of bookmarks is that they can be synchronized rather easily, be it with Firefox Sync or Xmarks.

Here is a list of some of the bookmarks I use almost every day, with URL and possible keyword. Don't hesitate on using them!

  • Acronym Finder (acro) http://www.acronymfinder.com/~/search/af.aspx?pid=osearch&string=exact&acronym=%s

  • Business Objects Board (bob) http://www.google.com/search?name=f&hl=en&q=site%3Ahttp%3A%2F%2Fforumtopics.com%2Fbusobj%2F%20%s

  • Cambridge Britsh English Dictionary (dicoen) http://dictionary.cambridge.org/search/british/?q=%s

  • Google Images (img) http://www.google.com/search?hl=en&q=%s&um=1&ie=UTF-8&tbm=isch&source=og&sa=N&tab=wi

  • Google Maps (maps) http://maps.google.com/maps?q=%s

  • Google US (ge) http://www.google.com/search?name=f&hl=en&q=%s

  • Google France (gf) http://www.google.fr/search?q=%s

  • Wikipedia English (we) http://en.wikipedia.org/?search=%s

  • Wikipedia French (wf) http://fr.wikipedia.org/?search=%s

  • SAP Notes (sapnote) https://service.sap.com/sap/support/notes/%s?nlang=E

If you have any further tips, or if you feel a useful bookmark is missing from my list, share it with us on a comment below!

SAP Strategy Management: When the Customization Generates New Standards

During the time we spent at our customer in Abu Dhabi, we learned a lot about the SSM customization until we realized that the final product could be a new standard instead of a customization. Our customer had some concerns about the out-of-the-box features and they were asking us to modify the functionality by adding new ones and automating the entire platform.

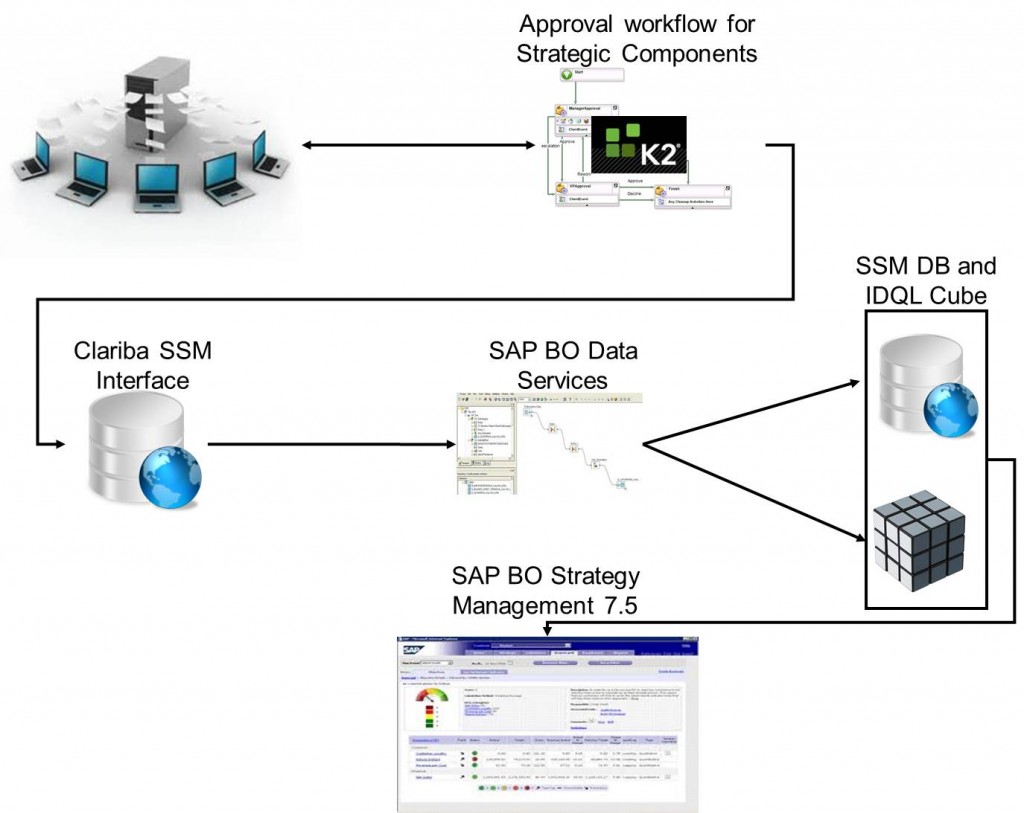
The biggest challenge we had was related to the approval work flow. How can the customer approve the creation of a new Strategic Objective? SSM does not allow the user to perform this task and our customer raised this topic as a risk. The work flow for the strategic components became a requirement from that moment. They asked us to use K2 black pearl, which for us was like a black box. We decided then to merge our teams and split the work in order to achieve the same goal.
We created a simplified SSM data model that reduced the number of tables needed to create a Balanced Scorecard and we connected it to SSM. From our interface we were able to populate any strategic components as well as the cube (using IDQL commands). We then created the database and a dedicated ETL (with SAP BO Data Services) that was populating the balanced scorecards.

On the other side of the desk, our customer was building the work flow in K2, creating the new web pages that are now replacing the SSM administration tool and connecting the output directly to our interface tables.

It took us a while before we got a chance to see something that was really working, but we did it; we built a powerful interface that creates balanced scorecards within SAP SSM.

In this interface everything runs automatically, the KPIs as well as the perspectives, the objectives, the initiatives and also the milestones are being updated by a scheduled ETL job in SAP BusinessObjects Data Services.

The customization we made can be summarized as follows:

  • Normalization and re-engineering of SSM tables (after performing a specific analysis on SSM data model) to create our interface DB.
  • Connection of our interface tables to the SSM tables.
  • Customization of the standard IDQL jobs that are updating the SSM Cubes.
  • Making SSM read-only to avoid changes on initiatives or milestones from the end user interface.
  • Making the SSM interface tables available for reporting and dashboarding as they can be included in a simple universe.

So far the only manual intervention that the customer needs to do is create the strategy maps. This step needs to be done from the SSM administration tool.


To conclude, the solution we explained above has been created as a customization but it can be adapted for any customer that might need this level of security and detail for their SSM implementation.

Part of this implementation could be applied for the companies that need to have an automated KPIs basket that does not includes any manual entry for the values (the final part of this solution can be considered as an SSM DB connector). This solution has been developed by using SQL Server 2008 but it can be connected to any data sources (i.e. SAP R/3, ORACLE DB, flat files, etc.).

If you think that this solution might work also for your company or your customers please feel free to contact us by email at info@clariba.com or by leaving a comment below.