
As SAP Analytics expert partners, we felt the need to develop an internal tool to help us measure a SAP BusinessObjects BI server’s (SAP BOBJ) performance to be able to optimize the handling of data and users. We needed to methodically and objectively measure SAP BusinessObjects server performance and benchmark it against other servers for effective server tuning.
In order to achieve this, we leveraged Apache Software Foundation's JMeter, as well as, plugins developed by this wonderful community. We then applied our Business Intelligence expertise to the results. With these capabilities in hand, we then moved on to develop a battery of test scenarios in order to account for several business cases that can be further tailored to suit any client's needs. The result is the Clariba SAP BusinessObjects BI Benchmark Solution.
But what is it?
A scalable series of standardized load tests tailored for the SAP BusinessObjects BI Platform environments and their reports and dashboards;
A quantifiable way to generate comparable insights about the SAP BusinessObjects BI Platform installation. Example: you change the configuration of one of the SAP BusinessObjects BI services and you want to find out the impact of that change on the server performance;
A way to help clients tweak their setup for optimal performance by seeing how changes in their server configuration improve the server performance, and consequently affect user experience positively.
How does it work?
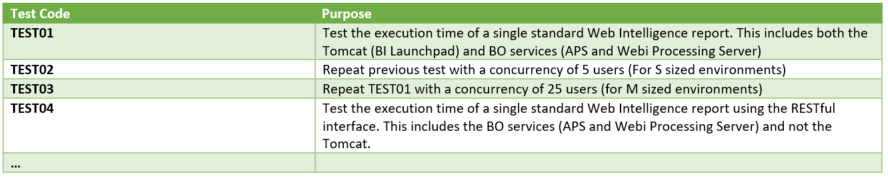
A series of unit tests allow to programmatically run SAP WebIntelligence demo reports that are varying in server load. As an example we use several executions at once to stress test the as if different users were requesting the same SAP WebIntelligence report. Or, we simply execute a set of reports a large amount of times to see how the server responds long term and leverages hardware capabilities like caching.
To further expand on the capabilities of the solution, we devised a series of tests that only request raw data, or execute the entire collection of components that make up a report like javascript and css files. As a result, we can differentiate between the Restful protocol (raw data acquisition and response to the client) and Tomcat (all of the additional files, as well as the data) capabilities of the server.
To date, we now have a set of 12 predefined tests which can be run on any SAP BusinessObjects BI Platform (plug and play) and based on the results and the hardware of the SAP BusinessObjects BI system, we can evaluate whether the software/hardware configuration and tuning of the environment is optimized or not.
What is the outcome?
Here an example of the benchmark in different systems with different hardware configurations. The better throughput, the better performance:
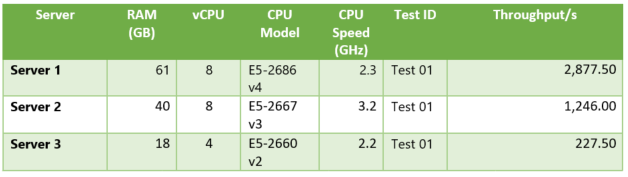
In the above example, Server 1 and Server 2 have similar hardware (Server 2 CPU should be a lot faster). However, Server 1 is properly tuned and delivering better throughput. In fact, using some of the additional modules developed by the community, we can tell exactly how and why by taking a peek under the hood of the hardware setup:

The test is a replication of a scenario where:
1 User logs in into SAP BusinessObjects BI Platform;
2 The user navigates to a folder in the SAP BusinessObjects BI Platform
3 User selects and opens SAP WebIntelligence report;
4 User selects another page;
5 User refreshes the data;
6 Users selects another page;
7 User closes document;
8 User logs out.
We can see where each of these actions happened due to a spike in server CPU activity. For example having a high and constant CPU consumption is a symptom of having low available CPU, or a bottleneck in other of the hardware components (memory or disk speed). The benchmark is therefore not limited to CPU, but also includes memory usage (RAM) and disk activity. Here is the memory monitor for the same case as above:

We can see that the server memory processed the test case without any significant change because we used a simple SAP WebIntelligence report for the business case. With the appropriate server tuning, it can easily handle this request. In some cases we have detected a heavy volatility of the used RAM memory due to a misconfiguration of the Java Garbage Collector.
The analysis of the Clariba SAP BusinessObjects BI Benchmark Solution is not limited to the shown charts. At the end of every execution, a CSV file can be generated with more details, and can be then used for as the basis for an entire universe of insights:

What else can be done?
The above benchmarks are executed using sample SAP WebIntelligence reports and Universes that are delivered in all SAP BusinessObjects BI installations. Imagine you want to benchmark your own SAP DesignStudio dashboards in order to measure performance after tuning the Apache Tomcat and services of the SAP BusinessObjects BI Platform.
Using the Clariba SAP BusinessObjects BI Benchmark Solution we can prepare a script to test its performance and concurrency, as well as identify how different configurations impact its performance and behaviour in different scenarios – i.e. adapting the tests for a few users requesting a lot of data or many users requesting only a single report. “What would it happen if 200 users want to see the same dashboard?” is as simple as selecting a different test or further customizing the parameters from JMeter’s graphical interface.

Next steps
We have already leveraged our benchmarking solution in some of our clients and we are looking to further improve the capabilities of the solution going forward.
Stay posted for more news about Clariba SAP BusinessObjects BI Benchmark Solution and don’t hesitate to reach out for any questions.