""

Device selection for SAP BI Mobile

For companies migrating to, or purchasing the newest SAP BI4 platform, a big question arises: which device should be acquired for employees to access BI? The answer to this question may vary depending on the user profile and type of information they want to access. This article focuses on apple and android devices which are the most sought after in the market nowadays.

Current SAP BI Mobile options

SAP BI currently has the following fastest growing options for mobile: The first 2 are apps freely downloadable from App Store or Google Play and a 3rd option is a direct access to an HTML5 Dashboard through an internet browser.

SAP BI Mobile: It allows visualization of developments from:

  • Web Intelligence
  • Dashboards (aka Dashboard Design or Xcelsius)

SAP BusinessObjects Explorer: It allows to interact with:

  • Explorer
  • Exploration Views

Dashboard Design HTML5 extract: This is a working non-refreshable dashboard item.


The advantage of this is that it does not require any SAP BusinessObjects platform and can be accessed from any browser like Safari or Goggle Chrome as well as desktops – not only tablets -. The disadvantage of this is only offline, not-connected models are allowed and no security can be applied so this option is usable as demo material only. If you want to achieve this follow the method described in this article.


Devices

The two device types that will be analysed here are tablets and phones.

IPad and IPhone by Apple are the ones currently well supported by vendor SAP, while some features can currently be accessed also by Android where unfortunately improvements are still pending in the area of Explorer and Dashboards and HTML5 during 2013. So for this reason this article will focus primarily on iOs devices. For a full specification of them check http://en.wikipedia.org/wiki/IPhone  and http://en.wikipedia.org/wiki/IPad


Applicability

Let’s consider the following case with four user types according to reporting information profile and role: Operational, Tactical, Strategic and Presales and the possibility of them having a phone, a tablet or both. Here is our recommendation for each technology option:

SAP BI Mobile: Web Intelligence

  • Operational Users
  • IPhone1 or higher
  • IPad1 or higher
SBO Explorer: Explorer

  • Operational Users
  • IPhone1 or higher
  • IPad1 or higher
SAP BI Mobile: Dashboards

  • Strategic Users
  • IPad 3 or higher
Offline HTML5 developments

  • Strategic Users and Presales
  • IPhone5
  • IPad3 or higher
SBO Explorer: Exploration Views

  • Tactical Users
  • IPad1 or higher

A summary table describing applicability is shown below. The criteria for selection is basically the RAM memory of the device which is in a direct relationship with the visualization process performance of a Dashboard.


Applicability of SAP BI option per iOs device


We found out that all of the devices with 512MB of RAM or less had difficulty processing a dashboard with 1000 rows of information or more. For instance the IPad1 could barely process 500 rows. The effects were a message popping up in SAP BI mobile: “Insufficient device memory - Loading failed: The dashboard is too complex” or the device Internet Browser freezing up or hanging up

Even if Android is not purely compatible just a few comments on our experience on it:

  • Some WebI components like single cells and small tables are quite well monitored in any device
  • HTML5 developments are partially viewable but some of the components show a corrupted appearance. The RAM limitation also applies, so Dashboards performance would only be good in devices such as Samsung Galaxy 3 or equivalent

For the time being we recommend to use Android for very operational users who just need a few lines of tabular information, until Explorer or Dashboard support becomes a reality. See in the table below the areas where Android currently can be tested. In here we do not refer to specific models because applicability and functionality also vary depending on the Android version.


Fig.2 Applicability of SAP BI option per Android device

Summary

The information here if not official from SAP, but are based on our experience. This article will need to be updated during this year 2013, based on the growing improvements that SAP is planning for, as well as new devices being launched in the market.

For now we can state that for iOS consumers who are strategic or working on presales require an IPad3 or an IPad4, and for operative users or tactical who do not need Dashboard capabilities will fulfill their needs with an iPhone.

Regarding Android users, the future is promising but in the meantime we recommend to use it for very simple WebI  developments only, no matter which device. And do not aim to use Dashboards or Explorer, hoping for a full compatibility during 2013.

If you have questions about this article, or if you want to share your experience or tips, please feel free to leave a comment.

Introduction to CMC Monitoring in SAP BO4 SP4

A few months ago a client asked me about how to be aware about problems (disconnections) in the different servers and services of their SAP BO4 SP4 without needing a person to constantly check the status.  I then started to research about the monitoring feature in the CMC. The truth is that there isn't too much information about it in the documentation, just some pages in the Platform Administrator Guide, or posts or references to this topic around the web. With this post, I will try to compile all this information I have found and will explain the use of these interesting features and give you a brief introduction to CMC Monitoring.

First of all, let me explain what is CMC monitoring: Monitoring is a new feature of the CMC that appears with SAP BusinessObjects 4 and allows Administrators to see the use and health of the BO system. For this, it uses watches, probes, metrics and alerts. There are some default ones, which allow the Administrator to start playing around with monitoring without a huge knowledge on the topic and obtain really useful information about the status of the system. Before using  this feature we need to know the actions we must perform and the existing limitations.

Also, we must ensure the information for monitoring is stored in the Monitoring database. This is a Derby database and it works independent from the other two DBs in SAP BusinessObjects. To activate the Monitoring database we need to log into the CMC, and go to Applications, and double click on the Monitoring Application. This will open the Properties window of the Monitoring Application. Make sure that “Enable Monitoring Application” is checked. Click Save and Close. The final step is to restart the Adaptive Processing Server (APS) if it was not checked. The information in the DB is deleted every time we reach 1GB of information. We can increase that size in the CMC.

Monitoring

To reach the monitoring section in the CMC, we need to go to Applications > Monitoring

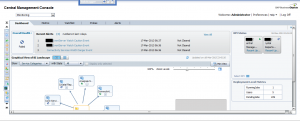
Monitoring default view

As we can see in the above image, there are 5 different tabs in this section: Dashboards, Metrics, Watchlists, Probes and Alerts. Let's run through each one:

1. Dashboards

it is the default tab and as the name says it is a dashboard which is divided in 5 parts:

  • Overall Health: It is an icon showing if the BO is working correctly or not.
  • Recent Alerts: Here we can see the alerts triggered the last 24 hours by the system.
  • Graphical view of BI Landscape: this panel includes a graphical or tabular view of the Watches within the system .We can drill down click in them.
  • KPIs Status: This part displays three Key Performance Indicators for the system. We also can drill down clicking on them.
  • Deployment Level Metrics: we can see 3 interesting metrics as the running jobs, the users and pending jobs.

2. Metrics

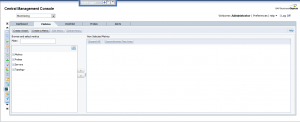
Metrics are individual pieces of information that contribute to know the health of the different components of the system.

Metrics image
Metrics image

Metrics are used to measure the health of a component. The metrics we define will depend on the components we are monitoring and our requirements. Examples of metrics are user login time, query execution time, CPU usage percentage, availability status for a system service, etc. We can use them in Watches and Alerts, setting thresholds for Warning and Danger alerts. There are around 250 predefined metrics. Furthermore, we can create our own metrics if we think they are necessary. Normally, with the default ones, we can check the status of almost everything in the system.

If we select a metric, we can observe the historical and current status of it.

3. Watchlists

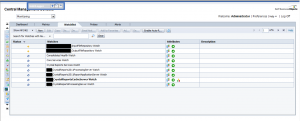
This tab lets us monitoring the watches that we have created. The watches are thresholds for metrics that show us if the metric is on a healthy, warning or in danger status.

Watchlists image
Watchlists image

Again, we have created watches by default. We can change these thresholds to adapt them to our system. Also, we can create notifications to the watches, hence, we can ask the watch to send an email if the system is in danger, for example. There are a lot of interesting options with the watches. I encourage you to try them by yourselves.

Finally, we can decide which are the watches that we want to see in the dashboard tab.

4. Probes

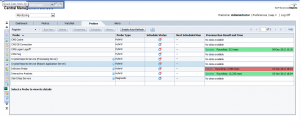
They provide us the ability to monitor our SAP BusinessObjects system, using simulated application work-flows which are run through SDK-based scripts.

Probes image
Probes image

This is the most interesting part of the CMC monitoring but,  at the same time, the most difficult. As we can create probes with a SDK, the power of this tab is huge. We could create whatever we want, but it is not very easy to create these probes. There are not examples around the net or they are very difficult to find. (I will try to add another entry in this blog in the future with an example).

As I mentioned before, the system will provide default probes. We can choose among 9, which are:

  • CMS Logon Logoff probe: Monitors if a user can successfully log on to the SAP BusinessObjects system and how long does it take.
  • Crystal Reports service through Page and Cache Server probe:  Monitors the availability and performance of the Crystal Reports service (through the page and cache servers).
  • Crystal Reports service through Report Application Server probe: Monitors the availability and performance of the Crystal Reports service (through RAS).
  • Infoview Probe: Monitors the availability and performance of logon/logoff the InfoView web application.
  • Web Intelligence Service Monitoring probe: Tests the availability and performance of the Web Intelligence Service through the report servers.
  • CMS Ping probe: Tests the core functionality of the CMS.
  • CMS Cache probe: Tests the availability of the CMS cache.
  • CMS Database Connection probe: Tests the connection to the CMS repository.
  • Start and Stop Servers probe: Tests to start and stop the different servers of the system.

5. Alerts

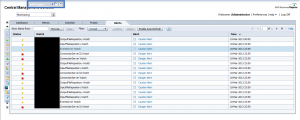
Here is where all the Alerts that we have set up in the Watchlist will appear.

Alerts image
Alerts image

This is a list of the alerts that the system raises. We can see the different details of the alerts when clicking on them. These alerts also can send emails and perform actions, depending on what we have set in the watchlist.

How to use all in one

With all the above information, I have explained an overview of the different tabs of the monitoring and also what we can do with each one of them.

If we want to tap the full potential, it is easy to see that all the tabs are connected and we need to use them all. One nice example could be monitoring the response time to open a report in the system. For this, we use the probe "Web Intelligence Service Monitoring" that logs in and we try to open and refresh a report in Web Intelligence. After this, we use the metric of the time that takes to the system to execute the probe and the metric that says if the probe was successful or not. Also, we create a whatchlist with this metric and if the probes takes more than 5 seconds, it will send an email advising the Administrator that the system is working a bit slow and if the probe fails or takes more than 15 seconds, it will send another email advising that the system is not working properly. We can schedule this probe to be executed on a daily basis.

With this simple scenario we are able to detect any problems in the system automatically, before any user reports it.  Moreover, the tabs' alerts will show us if there is something wrong that we had not noticed before.

Conclusion

As a conclusion, we can see that by playing around with all of these features, we can accomplish really interesting things and get most everything under control in our BO system. It could appear difficult to learn, but there are a lot of things that we can do just with the default settings. After you get used to them, it is time to play with the power of the self-created probes and add more personalized options to our monitoring.

I hope this introduction to monitoring has helped you to understand a bit more how CMC Monitoring works in SAP BO 4 SP4.

If you have any questions or suggestions, please leave a comment below.

Using a Java Application as a Source of information with SAP Data Services

After my post on how to Use Data Services SDK libraries to construct an AWTableMetadata in a Java application, in this post I will explain how to access a JAVA application as a source of information by using the WebService DataStore in SAP Data Services.

To do this we need:

  • Tomcat Server (where our service will be allocated Tomcat 6 BI4)
  • Axis2 Library (1.6.2)
    • Standard Binary distribution/zip
    • WAR distribution/zip
  • Eclipse (To construct our web Service)
  • Data Services Sp3


1. Building the web Service

Step 1: Unzip the the Axis2 WAR distribution inside of the folder…SAP BusinessObjectsTomcat6webapps replacing the actual Axis2 folder by default.

Step 2: Unzip the binary distribution of the Axis2 into a folder called Axis2 (C:Axis2axis2-1.6.2).

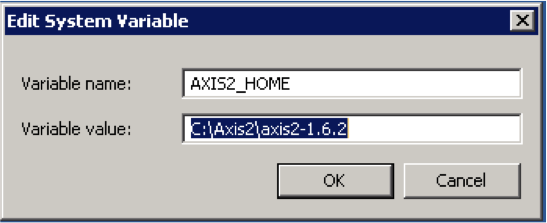
Step 3: Set system AXIS2_HOME variable. Go to Control panel -> System -> Advance System settings-> push the Environment Variables button and create the new one with this specification:

Step 4: Set up CATALINA_HOME variable. This is where the Apache Tomcat folder will be located. Go to Control panel -> System -> Advance System settings-> push the Environment Variables button and create the new one with this specification:

Step 5: Restart the Tomcat 6 Server. (turning off our BI4 installment during this process is recommended)

Step 6: Inside Eclipse right click to export our java application into a JAR File.

Step 7: Set the Export destination to the follow path:

 …SAPBusinessObjectsTomcat6webappsaxis2WEBINFservicesOURPROJECT.aar

 Where “OURPROJECT.aar” will be the name of our web service with .aar extension.

Step 8: Restart the Tomcat. Once Tomcat has started we have to access to this path http://localhost:8080/axis2/services and we should see this window:

Step 9: Click on our service in this case Clariba_SMT. We will redirect to the following URL:

http://localhost:8080/axis2/services/Clariba_SMT?wsdl

Copy this URL into a notepad for setting the Web Service Data Store.


2. Setting the Web Services Data Store in Data Services

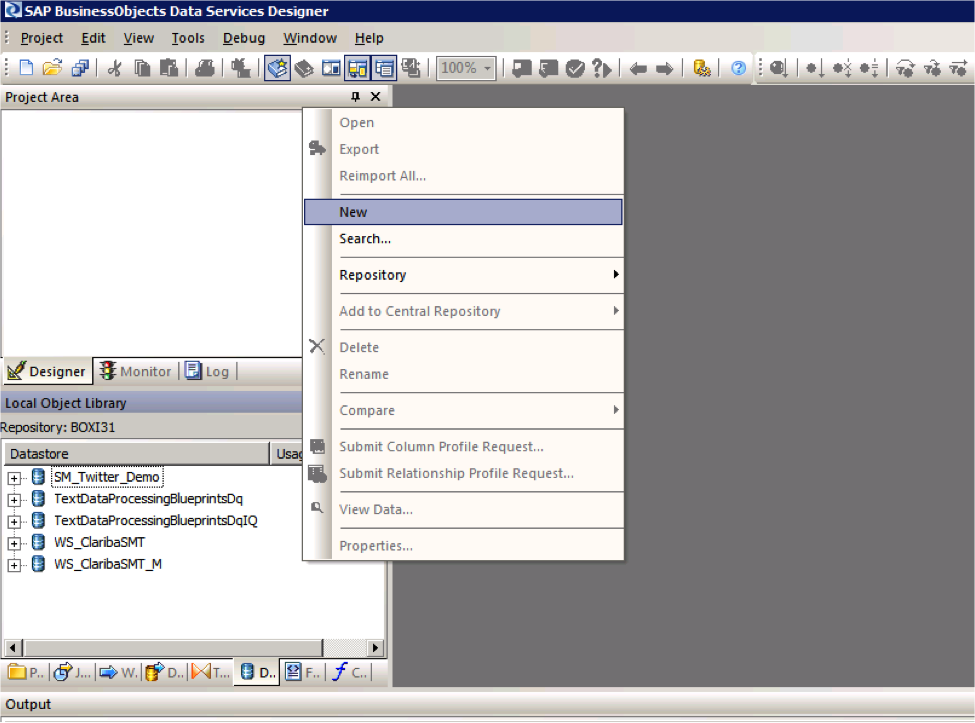
Step 1: Open the Data Store perspective and right click with the mouse and select New.

Step 2: Set the new name of our extractor as “WS_ClaribaSMT” and then put the URL where our web service is located. Data integrator needs the WSDL descriptor so we put http://localhost:8080/axis2/services/Clariba_SMT?wsdl

Step 3: Import the functions from the webservice that we are going to use. We select in this example“getTableTweeetsEN” for English and “getTableTweeetsES” for Spanish language.


Conclusion: Now we are ready to use our Web service as a Function Call inside a transformation in a Data Services Data Flow. Keep in mind that our Java Application has to return a type of value that Data Services can interpret easily for example a Table (See my past blog for more information). Subsequently we have to do a special set of transformations to interpret the information of the Web Services, which I will cover on my next post.

If you have any related tips or suggestions, please leave a comment below.

How to approach a Social Media Analytics project?

In previous occasions we have dedicated blog posts to the Social Media analytics topic, however we still had not written about which are the most common questions our projects must answer or which are the objectives we should aim for when we plan to extract insights from a Social Media network.


What you should deliver

Last year, SAP gave a series of webinars focused on Social Media (that you can find here if you have a valid SAP user) where they shared some interesting ideas about what a social media project should deliver to a customer. As consultants, we put a great portion of our efforts in endorsing our projects with as much value as possible, which was one of the topics discussed in these webinars. From them I extracted 4 principles that we should try to align our projects with in order to accomplish our goal of delivering value from Social Media analytics.

  • Speed: Social Media analytics must enable the customer to solve challenges faster through a comprehensive understanding of the technologies and experts related to their business. On the other hand, in a world where we have 6000+ tweets per second in average (source: https://twitter.com/TPS_watcher) there is a lot of information to analyze and not enough time to digest all of it, so we have to make sure that whatever our customer is analyzing from their social networks we are able to do faster!
  • Impact: The data that you extract and produce needs to give the necessary information to the customer to enable them to drive higher quality outcomes and build a reputation among their targets in the social networks. If you know what your target is hungry for, the easier it gets to satisfy their needs. Your analytics must be capable of making the customer understand how much they stand out and to monitor their presence in the social networks.
  • Insight: This principle is also related with the above in the sense that when your customers are constantly listening to what experts in their industry are talking about, they could benefit from that collective wisdom to innovate and differentiate themselves from other competitors. It is not just a matter of gathering data, it is also necessary to gather knowledge and trends. It also comes without saying that this also applies to monitoring what your customers' prospects are saying, an accurate and timely understanding of their needs or opinions, increases your customer’s probabilities of delivering what they want.
  • Efficiency: With all the information that you deliver from the Social Media analytics, you can make it possible for your customer to reduce time and investments spent in the monitoring of their Social Media activity. You should deliver with a server in minutes (why not in real-time?) what several brains take to process in many hours of work.

What you should be asking

One of the main risks of these projects is that it is very easy to lose yourself in the gigantic amount of information that you can extract, so from the very beginning you have to determine the main questions that your customer wants answered and solely focus on them. In my opinion, the most common key points that you should always look for are:

  • Who are the business influencers and what are they talking about?
  • What is the competition doing and how are they using their Social Networks? How big is their impact compared to your customer's?
  • Which are the Social Media networks that are best suited for your customer's needs?  Are they being used enough?


What are the benefits for your customer

Now, imagine yourself in a position where you have to sell the key benefits to a potential customer. He does not want to hear the whole “Social Media is the future” speech, he just wants you to get to the point… If your project can deliver these points below, you will be indubitably in good shape:

  • Discover key business influencers and reach them
  • Design effective strategies assessing the competition’s activities
  • Understand if the message sent to the target has good visibility

If you have any questions or anything to add to help improve this post, please feel free to leave your comments. You may also find other interesting articles related to this topic in our blog here.

Providing SSM data to SAP BusinessObjects reporting tools - Exhausting all scenarios

In the last two months I have been in a couple of customers who were interested in the integration of SAP Strategy Management 10.0 with SAP BusinessObjects BI Platform 4.0. In this post I would like to explain what that integration is about.

First of all, a brief introduction about the solution. The SAP Strategy Management (SSM) software allows aligning the Strategy Plan of the company and its key objectives and spread it across all the organization. It is an out of the box Enterprise Performance Management solution in which you can insert the most important KPIs of your company in Balanced Scorecards or Strategy Maps and control their performance in relation to the Strategy of the company. Within SSM you can also create initiatives to implement improvements or corrective actions and link them to the objectives or KPIs.

Sometimes the customer has requirements to implement reports or further analysis on top of SSM and these cannot be covered with the standard functionality of the solution. In that case, the best option is to implement the integration between SSM and SAP BusinessObects reporting tools. Some examples of what you can do with that integration:

  • Implement bespoke Dashboards with your SSM KPIs and Objectives
  • Implement universes and allow users to exploit information from SSM with Web Intelligence without consuming additional SSM licenses
  • Implement pixel-perfect Crystal Reports on top of the SSM
  • Foster ownership with Publications. For example, send a list of KPI’s that are not performing well to their responsible users

For implementing such integration, you can follow the SAP SSM Configuration guide. However, in some cases, there is lack of documentation and you have to do things outside the script. In other cases, the existing documentation has not been updated yet to BI 4.0 and SSM 10.0. And finally, sometimes the documentation is wrong or the software has bugs and you cannot setup the integration.

In this post we will analyze following scenarios:

  1. Web Intelligence reporting on top of a SSM Models
  2. Web Intelligence reporting on top of a SSM Data Model (Clariba-developed solution)
  3. Crystal Reports on top of SSM (exploring different options)
  4. Dashboards on top of SSM (exploring different options)

These scenarios have been implemented with following software components:

  • SAP NetWeaver 7.3 SP08
  • SAP SSM 10.0 SP06
  • SAP BusinessObjects BI Platform 4.0 SP05
  • Crystal Reports 2011 SP05
  • Dashboards 4.0 SP05

1. Web Intelligence reporting on top of a SSM Model

As per SAP documentation, we can setup the ODBO Provider in order to build a Universe on top of SSM Models. The problem is we still have to use the Universe Designer instead of the Information Design Tool of the BI 4.0. Bellow are the steps for setting up the ODBO Provider and implementing your first report on top of the SSM:

  • Go to your BO 4.0 server and make sure you have a Multimensional Analysis Service in the BO server. Stop the MDAS Server and the Connection Server in the Central Configuration Manager
  • Copy the ODBOProvider folder from the <drive>:Program files (x86)SAP BusinessObjectsStrategy ManagementInternetPub path of your SSM server to the BO server
  • In the SSM server, run the SSMProviderReg.bat file in the BO server. Make sure you have administrator rights in the BO server. Once completed, check in the regedit that you are able to find the register SSMProvider.1 in the Windows register
  • Modify the windows register to insert following string in that path (assuming that you are using a 64-bit Windows): HKEY_LOCAL_MACHINESOFTWAREWow6432NodeSAPSSMODBOProvider "servletUri"="/strategyServer/ODBOProviderServlet"
  • Access the following path in BO server: <drive>:Program Files (x86)SAP BusinessObjectsSAP BusinessObjects Enterprise XI 4.0dataAccessconnectionServeroledb_olap

<DataBase Active="Yes" Name="Strategy Management 10.0">

<Aliases>

<Alias>Strategy Management 10.0</Alias>

</Aliases>

<Library>dbd_sqlsrvas</Library>

<Parameter Name="Family">SAP BusinessObjects</Parameter>

<Parameter Name="Extensions">sqlsrv_as2005,sqlsrv_as,oledb_olap</Parameter>

<Parameter Name="MSOlap CLSID">SSMProvider.1</Parameter>

</DataBase>

  • Start the MDAS Server and the Connection Server
  • Now we can go to the Universe Designer and start implementing a Universe on top of our Model. The first step is defining the connection. In the connection list (retrieved from the Connection Server) we can see now the new register we have inserted, Strategy Management 10.0:
  • Define the connection parameters. You must be an SSM user with proper permissions and you must inform the server's complete address (FQDN) and its port.
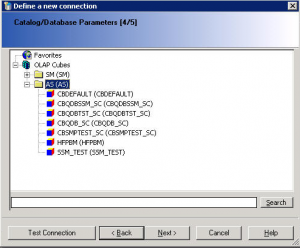
  • Once connected to the SSM server, you will see the list of available Cubes. The AS category allows access to the measures (based on attributes and dimensions) in the Application Server model.The SM Adapter allows access to the strategy dimension, which represents the strategy management dimensions Scorecard and Initiative. Scorecard detail not relating to the KPI such as comments are not presented.
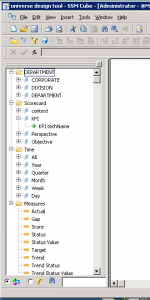
  • And finally we will see our universe with the available dimensions, the standard classes (Time and Scorecards) and the measures. You can display the technical names of the objects as detail or you can define hierarchies of Perspectives, Objectives and KPIs.
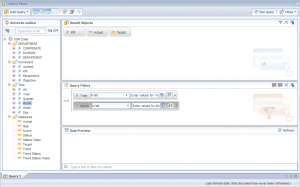
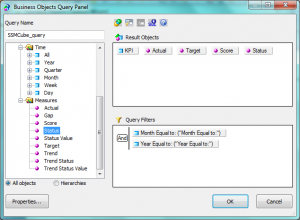
  • Now we can publish the universe and go to the Web Intelligence to start implementing our reports on top of the SSM models.

2. Web Intelligence reporting on top of SSM Data Model

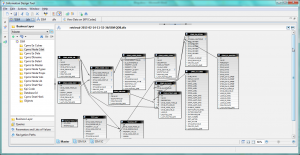
That is a solution you can implement if you have an advanced knowledge of the SSM Data Model. You can implement a UNX Universe with the Information Design Tool by linking all the tables of the Entry and Approval, the Nodes of the Scorecard, the Cube Builder or the Initiatives. The advantages of that option is that you have access to extra information not available in the SSM Cube,  such as the Initiatives, the users related to specific KPIs, the attributes of the KPIs etc.

If you are interested in such an option, please, contact us. Keep in mind that it is not a supported option from SAP but we have implemented it many times and we know it works.

3. Crystal Reports on top of SSM

The integration of SAP Crystal Reports with SSM can be done by 4 different ways:

  • Implementing a Query as a Web Service from the Universe, built in previous steps: we have managed to implement that scenario
  • Connecting Crystal Reports to the Universe on top of the SSM Models we have built in the first step: that scenario is not working although we followed the instructions from SAP
  • Using an OLE DB (ADO) connection: this option, not explained by SAP, is available if we install the ODBO provider but we have not managed to make it work
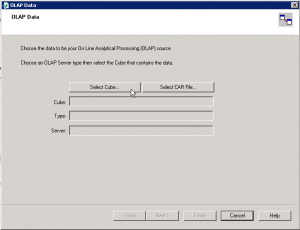
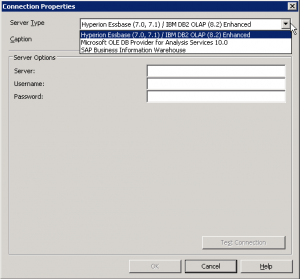
  • Using the OLAP Connection: according to SAP Documentation, we can build an OLAP Cube Report in Crystal Reports. We should be able to select the Strategy Management option in following screen to inserts SSM connection data, but we have not been able to find that option

4. Dashboards using Web Services Connections

Using Dashboards, you have two different ways to implement the access to data:

  • Implement a Query as a Web Service (QaaWS) to retrieve the relevant information from the Universes we had implemented before.
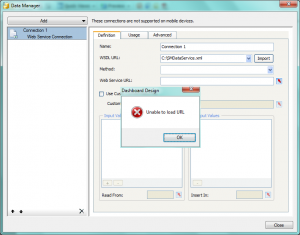
  • Use Web Services available in the SAP NetWeaver to retrieve information from the SSM:  according SAP documentation you need to download the WSDL file SMDataServiceService and CubeServiceService applications and call the functions within them. With our Dashboards 4.0 SP05 we have not been able to process the WSDL files as the tool is unable to load the URL.

Summary

Providing SAP Strategy Management information to SAP BusinessObjects BI Platform 4.0 can enhance the capabilities of your Strategy system. However that integration is not so easy given the lack of information on that topic and the quality of the existing information. We tried to implement all possible integration scenarios and we have succeeded with Web Intelligence and this is the route we recommend  as the scenarios related to Crystal Reports and Dashboards the integration were not working when using SSM 10.0 and BI 4.0.

We will be following-up these issues and let you know if we finally manage to solve them. If you have any suggestions or if you found a workaround to these issues please leave a comment bellow.

Join Clariba at the SAP Forum Oman on March 6

Clariba is pleased to sponsor SAP Forum in Muscat. This is the first SAP Forum event to take place in Oman, following the recent opening of SAP offices in the country in 2012 to better serve local clients.

Aimed  at C-level executives, IT decision makers and Business managers, SAP Forum is an unmatched chance to investigate the entire SAP ecosystem in one day, and understand the value it can bring to your business.

At the SAP Forum Oman you will be able to:

      • Network with industry peers
      • Hear about the experiences of SAP customers and how SAP solutions have been helping them run their business better
      • Gain insight from thought leadership keynotes from SAP´s top level management
      • Catch focused presentations on  topics like Rapid Deployment solutions, Cloud, In-Memory, Analytics and Mobility
      • Meet Clariba and other SAP partners at the exhibition area


A recognized SAP Gold Partner, Clariba is a leading SAP Business Intelligence consultancy in MENA and a specialist in SAP BusinessObjects and SAP HANA technologies. You are invited to meet the Clariba team at our booth at the exhibition area. There you will be able to see our dashboard and reporting solutions developed for our clients - leaders in a variety of industries such as telco, banking and oil & gas.

“Clariba is excited to take part in the first SAP Forum Oman, says Marc Haberland, Managing Director of Clariba. “Clariba is already working in Oman and we are thrilled to see SAP investing in the region as well. Come meet us at the Exhibition Zone for insights in innovative business intelligenceenterprise performance and information management solutions."


Attendance at the SAP Forum Oman is free of charge. 
Register now to secure your place.

Details of SAP Forum Oman

Date: March 6th
Time: From 8:30 a.m. to 4:30 p.m.
Location: Al Bustan Palace, A Ritz-Carlton Hotel, PO Box 1998, Muscat 114 Oman 
Register now


Your Invitation to SAP Forum Oman on March 6


SAP FORUM, Oman

Join Clariba at the first

SAP Forum in Oman

Register Now


Mark your calendar

Date: 6 March, 2013
Timings: 08:00 – 17:00
Venue: Al Bustan Palace-Ritz-Carlton 
Cost: Free to attend

Find out more ›

We are ready to inspire innovation at the SAP FORUM Oman. This time it is coming to Muscat, Oman on 6 March, 2013. Experience the most awaited annual SAP event focused on expanding your technology knowledge, enriching your business value and discovering how SAP solutions can help companies like yours run like never before.Here’s a brief intake on what you can experience at this year’s SAP FORUM:

    Hear from SAP executives and thought-leaders about the latest essential business technology trends and innovations like Mobile, Cloud and Analytics
 
      Participate in highly informative, collaborative panel discussions and breakout sessions, led by today’s leading SAP evangelists and experts who can help you transform the way technological innovation is leveraged for ongoing business value
 
      Gain valuable insights by listening to the real-world experiences of SAP customers who will share their experiences in successfully implementing SAP solutions
 
       Get an in-depth look at future SAP applications that support your growth strategies, create a competitive advantage and provide positive impact for your business
 
      Interact with our Partner Ecosystem in our Exhibition Showcase to experience current SAP-supporting technologies and services

This is your time to network with SAP executives, meet our entire ecosystem in one place and learn how SAP can help companies like yours Run like never before.

Attend our Dubai event - Taking your business to new heights with SAP HANA & Business Intelligence

Taking your business to new heights with SAP HANA & Business Intelligence.

Hands-on experience on how convergence to in-memory, real-time analytics can help accelerate your business.


Register Now

SAP, Clariba & Fujitsu cordially invite you to learn SAP’s strategy to fast-forward your business to real-time analytics with this session on SAP HANA & Business Intelligence.
You will experience how your end-users can leverage the power of SAP HANA for instant analysis of structured and unstructured data with SAP's leading BI solutions. Furthermore learn how business users can easily extract actionable insight from vast amounts of data with speed-of-thought analytics and predictive analysis
.

Agenda Overview

08:30am - Registration & Coffee Break

09:00am - Welcome & Introduction

09:15am - Where is SAP going with BI? (SAP)

10:00am - Real-Time Data Platform (SAP)

10:45am - Mid-Morning Coffee Break

11:00am - Taking Your Business to New Heights with SAP HANA (Clariba)

11:45am - Introduction to SAP HANA Infrastructure (Fujitsu)

12:30pm - Wrap-Up

12:45pm - Lunch

02:00pm - SAP HANA Hands-On Session (HANA Technical Academy) for up to 10 participants* 

We look forward to seeing you there.

* fully booked

Dubai, UAE

March 13th, 2013

8:30am - 05:00pm
Radisson Blu Hotel
Dubai Media City

Click here to register

Attend our Event - Real Time Business Visibility with SAP BusinessObjects & SAP HANA- Kuwait and Bahrain

.


Real-Time Business Visibility  with SAP BusinessObjects and SAP HANA. Join SAP and Clariba and discover how to gain actionable insights from your Oracle eBusiness Suite and other mission-critical systems.

. . Register Now

We would like to invite you to learn how to put enterprise-wide data on your Oracle eBusiness Suite (EBS) to use in order to make timely decisions, using SAP BusinessObjects revolutionary real-time processing technology. The detailed agenda for this half-day event is the following: - Registration & networking breakfast: 8:30- Welcome & overview: 9:00

- Real-time business intelligence: 9:15

Demo of Real-time Business Intelligence (BI) dashboard and reports, running in real time

Brief introduction to SAP BI Suite

Discover self-service analytics with Visual Intelligence

- Predictive analytics in real-time: 10:00

Demo of trend and scenario analysis

Decisions on-the-go with SAP BI Mobility solutions

- The real-time technology revolution:10:45

Business case for SAP Real-Time Data Platform (RTDP)

Building a solid data integration strategy

- Coffee & networking break: 11:00 - Taking your business to the next level with SAP HANA for Oracle EBS by SAP Gold Partner Clariba: 11:15

Challenges today (explosion of data, complex data sources, need for agility and rapid deployment of solutions

Business case including demo with Oracle EBS data

Business benefits and time-to-value

Brief talk on abundance of hardware solutions that match any requirement and existing install base

- Best time-to-value with SAP Rapid Deployment Solutions (RDS) by SAP Gold Partner Clariba: 11:45                              

Overview of RDS

Fixed price, fixed time, fixed scope projects

Examples of RDS & benefits to customers

- Wrap up: 12:15                                      - Lunch: 12:30  

Meet the experts over lunch

We look forward to seeing you there.

Kuwait March 4th, 2013

Venue: Courtyard Mariott

Time: 9:00am to 2:00pm

Kuwait City, Kuwait

To register click here

March 5th, 2013

Venue: Ritz-Carlton Hotel

Time: 9:00am to 2:00pm

Manama, Bahrain

To register click here

For more Information

www.sap.com/mena

Using Google Chrome with SAP BusinessObjects

We all know that there are many internet browsers available, but definitely Google Chrome is one of the most used nowadays and therefore we have had a lot of feedback from our customers related to using chrome with SAP BusinessObjects.

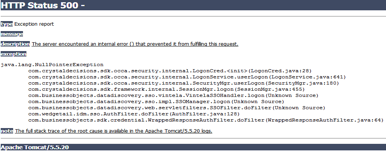
A main problem found by users is that when using Google Chrome on InfoView or BiLaunchPad a missing plug-in error screen appears when you are trying to modify a report and it also shows a HTTP Status 500 error screen when trying to log in to SAP BusinessObjects Explorer. In this blog I will provide a solution these issues.

Issue when login to InfoView or BILaunchPad in GoogleChrome
Issue when accessing SAP BusinessObjects Explorer

The solution we have found is to use a Google Chrome add-on called “IE tab”, which emulates Internet Explorer on Chrome.

Steps to install it:

  1. From Google Chrome, introduce the link in the url bar and install the add-on.                                                                                       https://chrome.google.com/webstore/detail/hehijbfgiekmjfkfjpbkbammjbdenadd
  1. Once installed you will see a small folder with the IExplorer logo on the top right corner of google chrome.
Folder with Explorer logo
  1. Click on the folder and another url bar will appear
URL bar appears
URL bar appears
  1. Introduce the Infoview / BI LaunchPad link in the new bar and start working with it.

Moreover, in case you need to click on an Open Document link and you want Google Chrome to be opened up automatically with it you will need to add your server’s url so it can open successfully, for this you need to follow these steps:

  1. Right click on the small folder with the IExplorer logo
  1. Choose Options
  1. Add the server’s address text in the Auto URL’s field

The outcome

SAP BusinessObjects web based applications can be successfully used with Google Chrome, see below the following examples:

Modifying a report on InfoView
Viewing and managing spaces from SAP BusinessObjects Explorer

Summary

The main benefits of applying these tips are, with the help of Google Chrome:

  • Modify documents on Infoview / BILaunchPad
  • Log in and manage spaces in SAP BusinessObjects Explorer
  • Increase the speed of navigation while going through the platform folders

According to the SAP’s official PAM (Product Availability Matrix), Google Chrome is not entirely supported due to its fast development speed, so the use and frequent update of this add on is highly recommended.

Hope this will help you have a better experience when working with SAP BusinessObjects. If any doubts or suggestions please leave a comment below.