
Are you satisfied with the way you currently manage the dependencies in your ETL? In Part 1 of this series, I talked about the features I expect from a dependency management system, and what are the main possibilities offered (directly or indirectly) by Data Services. In Part 2, I proposed an architecture (structure and expected behavior) for a dependency management system inside Data Services. Now I will give you the implementation details, while a feedback on how it went “in real life” as well as possible improvements will come in part 4. So how do we implement this theoretical solution in Data Services?
Common SAP Dashboards (Xcelsius) bugs and how to solve them
This post is about SAP BusinessObjects Dashboards (formerly known as Xcelsius) and its intricate form of work. If you are an assiduous dashboard developer or just beginning to work with the tool, you will notice some bugs that interfere with your developing and slows you down. My main goal is to talk about the bugs or "misfortunes" that I have commonly faced in SAP BO Dashboards (Xcelsius) and the workarounds that I have found to save you some time when working with this tool. My second objective is to open a discussion where you can comment on other SAP Dashboards issues and solutions you found.
Dashboard integration in SAP Crystal Reports
In this blog article I would like to share with you how to embed a dashboard in a Crystal Report using flash variables. First of all let’s give a scenario that leads us to do that. In this case we wanted to create a dashboard for a SAP GRC module. The problem was that we could not connect to the system directly with SAP BusinessObjects Dashboards (Xcelsius for the most nostalgic ones). Apart from that, there is a good thing about having a dashboard embedded in Crystal, you will have a dashboard that can be refreshed from Crystal Reports without needing a previous authentication. You will also be able to save the “report” (you can show the dashboard) in PDF with saved data and the dashboard will be completely clickable and navigable.
How to load and read Web Services Data Store in Data Integrator
On this article I will teach you in 12 steps how to load and read the information retrieved by a WebService based on a Java Application as a source of information. This is has a very important feature if for example you are building Java Social Media applications that read information from the Internet or if you have constructed a Java application that retrieves information in Json Structure XML. I will show you how Data Services makes requests and interprets replies from a web service Data Source.
If you need background information on the first steps of my process, I have done a first post on how to use Data Services SDK libraries to construct an AWTableMetadata in a Java application, followed by the post where I explained how to access a JAVA application as a source of information using the WebService DataStore in SAP Data Services.
If you already read my previous blogs, lets jump into how to load and read Web Services Data Store in Data Integrator.
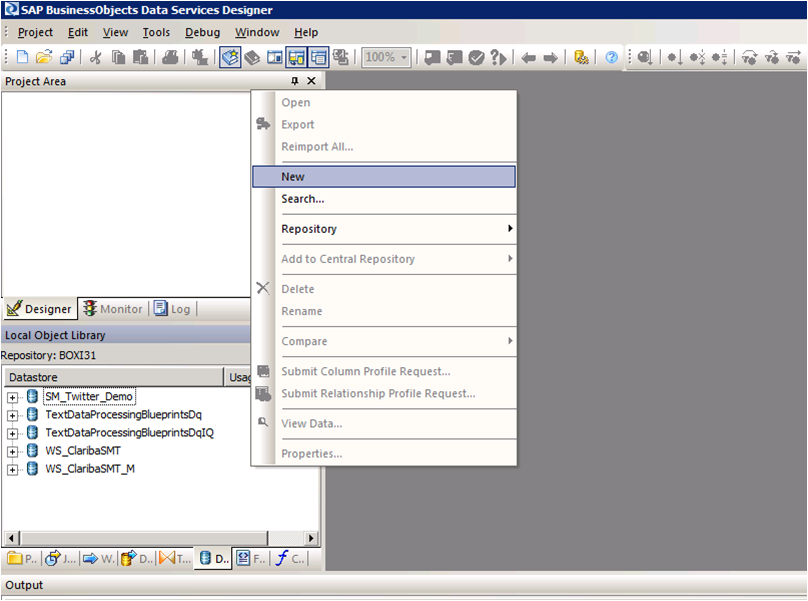
Step 1:
Open Data Services Designer. Go to the Data Store perspective and right click with the mouse and select New.
Picture1
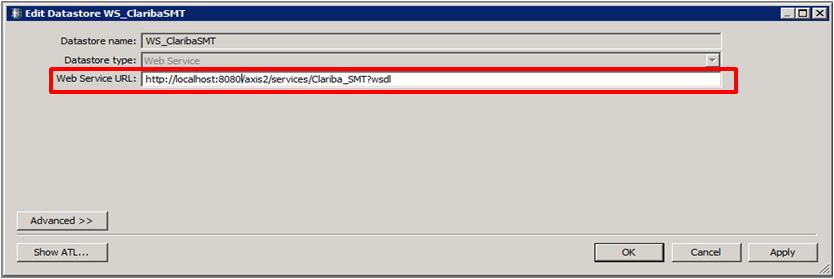
Step 2:
Set the name of the extractor and the URL where your web service WSDL is located (see my previous blog for reference).
Picture2
Step 3:
Right Click on the “f(x)” symbol and select Import. Choose the functions from the webservice that you are going to use. In this example we select “getTableTweeetsEN” and “getTableTweeetsES”.

Picture3
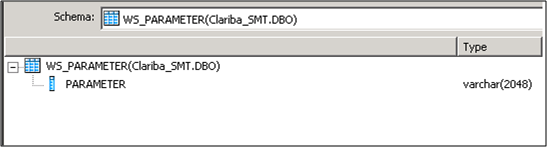
Special Note:
To access to these functions inside a transformation we have to use the function call Schema provided by Data Services. In this case the function getTableTweets_EN receive an input and returns a table (AWTableMetadata table). This return type comes in an especial nested form from our Web Service. We will have to resolve this nested schema doing a couple of transformations below.
Picture4
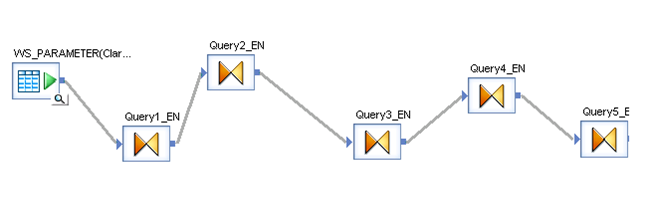
Step 4:
Select the input parameter for the functions; in this case it is a field from a table called “WS_Parameter”. We select that table as a Source table and our first item in our data flow.
Picture5
Step 5:
Insert a transformation in the data flow as your second item. In this first query (Query1_EN). We create a SCHEMA called Schema 1, and assign the field came from the database “Parameter” as an attribute of this Schema.

Picture6
Step 6:
Create a second transformation (Query2_EN). This query will be in charge of calling the web service with the input parameter using the Function Call procedure. Right click on the Schema Table called Query2 and select new Function Call.
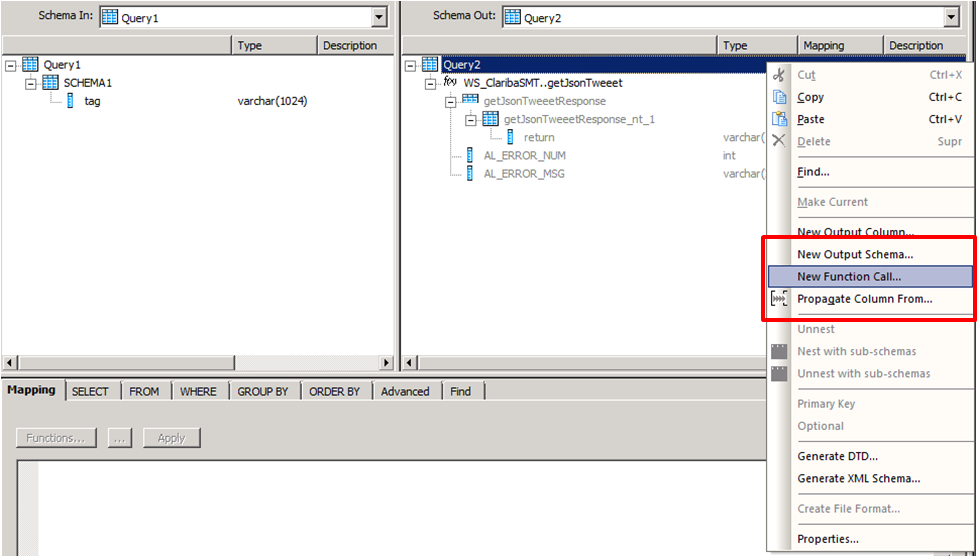
Picture7
Step 7:
Select the WS_ClaribaSMT dataSotre in the left panel, the right panel shows the functions that we imported to the Data Store. We select the first one getJsonTweet (For English Language) and click next.
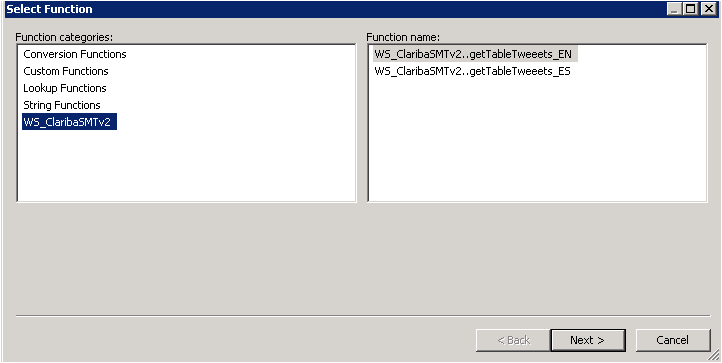
Picture8
Step 8:
We have to map the new function call Schema with the new Schema1. This is the structure used to call a Web Service in Data Services. In this case we are calling the function getJsonTweets_EN with a parameter nombre. Structure that matches our SHEMA1. Then click Finish.

Picture9
The final result will contain the function call. You can add also an attribute below the function call. In this case we add “load_date” containing the sysdate representing the date of the load data.

Picture10
Step 9:
The third query will be in charge of the recognition of the data returned by the Web service. In this case the Schema is in the left panel. To capture this on Data integrator we need to unlace this Schema until we get to the “return object” which contains the Data.

Picture11
We click on the left panel above the getJsonTweetResponse and drag it into the right panel. Then we do right click on the getJsonTweetResponse from the right panel and select the option “Unnest”. This will cause the split between the schemas. We proceed to capture it in the next nested query.

Picture12
Step 10:
We do the same procedure in the query 4, drag the getJsonTweetResponse to the right and unnest it.
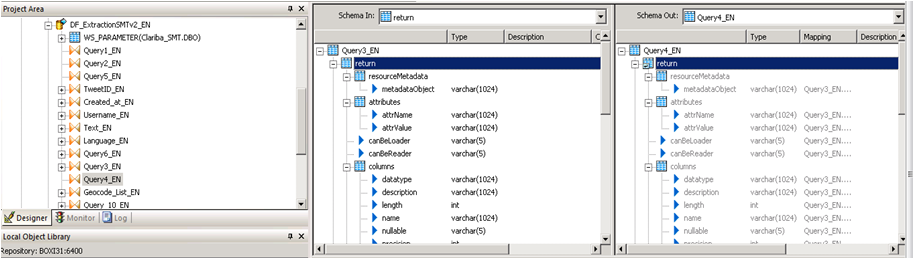
Picture13
Step 11:
Query 5_EN contains the final result which be two variables that contains the header of the table plus the Load Date.
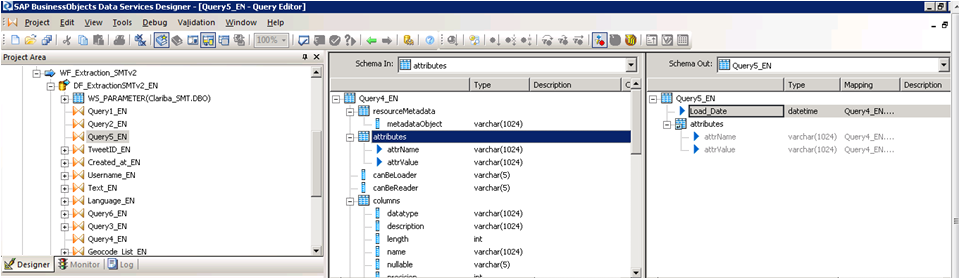
Picture14
Step 12:
The last step depends on the implementation and the business rules. The table returned will have this format.
Column1
Value 1
Column 2
Value 2
Column N...
Value N…
Conclusion
This method applies particularly if you are using function call schema and an array as return type for your web service. If your source is another thing different to an application the resolution of the web Service may vary. The method for mapping the final table is up to you and your business needs. A easy solution could be aggregate an ID to each row.
If you want to have more information please read my previous blogs or leave a comment below.
Spicing up your Dashboard with a clickable moving Ticker
Looking forward to add a little more to your visualizations? Spice them up with a clickable moving ticker! For those who are not familiar with Dashboard Design (formerly known as Xcelsius), a moving ticker is a banner which has a similar look to a stock market ticker displaying customized moving labels from right to left. The one described here is also clickable, which means that when you click on any label it can execute many actions such as opening URL’s.

We always try to build dashboards that people really use, and for that we need to find a balance between functionality and design. The design might not seem as important as the functionality, but trust me, in order to get the attention of users you need to build something that really catches their eyes, such as this ticker feature which is easily noticeable to do it´s constant movement.
Step by step process
In order to help you make your Dashboards eye-catching, I am going to show you how to build a clickable ticker to open URL’s with the following steps.
Let’s start by organizing our spreadsheet (find example below – Fig.1) with the following information:
- Labels: Information that will be displayed on the ticker
- URLs: Links that will be opened when clicking on the labels
- Auxiliary info: cells containing Index, destination, status, key, URL to open, which will be explained later on

When your spreadsheet is ready follow these steps:
1) Drag and Drop the ticker object to your canvas.
The ticker object can be found under the category “Selector”.

2) Configure the Ticker object’s properties.
In the General tab, assign the labels you would like to show on the dashboard.
Insertion type: Position
Destination: This cell is key as it will give the position number of the clicked label on the ticker.
e.g: If you click the third label of the ticker this cell will be a “3”, it it will change when you click another label.

3) Drag and Drop a URL object to your Canvas.
The URL object can be found under the category “Web Conectivity”

4) Configure the URL object’s properties and behavior.
URL: In this cell you need to build a “vlookup” formula as it is shown in fig.1.

In the behavior tab under the Trigger Behavior properties you find:
Trigger cell: This is going to be the same as the destination cell of the Ticker (Sheet1!D$4 in this case – Fig 2.).
Check the “When Value Changes” option.
Hide this button by selecting different values for the status and key cells as below:

The outcome and conclusions
After completing these steps you should have built a clickable moving ticker which will spice up your visualization.
This solution will allow you to:
- Open Intranet/Internet URL’s from moving labels.
- Change visibility dynamically for graphs and images from you Dashboard Design visualization.
- Enhance the design and gain visibility of your visualizations
I hope this feature is useful to you and it brings positive feedback from your end users. Please feel free to leave a comment or question below.
Managing ETL dependencies with SAP BusinessObjects Data Services (Part 2)
Are you satisfied with the way you currently manage the dependencies in your ETL? In part 1 of this article, I talked about the features I’m expecting from a dependency management system, and what are the main possibilities offered (directly or indirectly) by SAP Data Services. Now (part 2 of the article), I’m going to propose an architecture (structure and expected behavior) for a dependency management system inside Data Services. The implementation details will come in part 3, while a feedback on how it went “in real life” as well as possible improvements will come in part 4.
The proposed architecture
What I’m going to develop now is the following: an improvement of the “One job with all processes inside” architecture.
The main features of this architecture are:
- Management of multiple dependencies (one flow can depend on multiple processes)
- Graceful re-start is possible. Full ETL restart is also an option.
We should first create two tables, FLOW_DEPENDENCIES and FLOW_STATUS.
- The table FLOW_DEPENDENCIES has two columns FLOW_NAME and PREREQUISITE. It has one line for each prerequisite.
For the example below (logical flow dependencies in a job)...
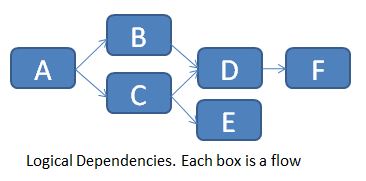
... we would populate the table FLOW_DEPENDENCIES as follows:

Of course you can’t directly implement these logical dependencies in Data Services, so you need to chain them one after the other.

The table is manually updated every time there is a new prerequisite. A flow without prerequisite doesn’t need any row in this table (see flow A for example).
The table FLOW_STATUS keeps track of the different flow statuses (Already run, Success, Failure, Missing Prerequisite) for each execution of the main job. The 3 columns are JOB_KEY (which contains a surrogate key for each new execution of the job), FLOW_NAME and STATUS.
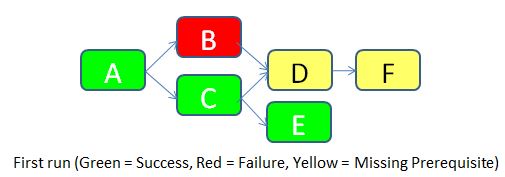
To make things clear, let’s imagine that we run the job for the first time (JOB_KEY = 1).
- Flow A doesn’t have any prerequisite, so it’s allowed to run. It is successful. A row with STATUS = Success is inserted in the FLOW_STATUS table.
- Flow B has a prerequisite according to the table FLOW_DEPENDENCIES (the flow A), so it checks the status of flow A in the same run. It turns out that the flow A was successful, so flow B is allowed to run. Unfortunately, it fails for an unknown reason. A row with STATUS = Failure is inserted in the FLOW_STATUS table.
- Flow C is allowed to run according to the same logic as for flow B. It runs successfully. A row with STATUS = Success is inserted in the FLOW_STATUS table.
- Flow D has two pre-requisites according to the table FLOW_DEPENDENCIES (flows B and C). It checks the status of both. As the flow B failed, the flow D is not allowed to run. A row with STATUS = Missing Prerequisite is inserted in the FLOW_STATUS table.
- Flow E is allowed to run according to the same logic flow B. It runs successfully. A row with STATUS = Success is inserted in the FLOW_STATUS table.
- Flow F has a prerequisite (Flow D). But as the status of flow D is “Missing Prerequisite”, flow F is also not allowed to run. A similar status is inserted in the flow status table.
Below are the rows inserted in the FLOW_STATUS table during this job execution.
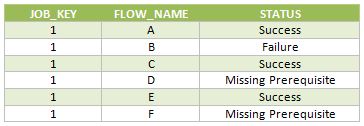
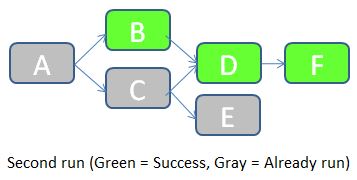
Once the error cause in the flow B has been corrected, we can re-run the job. JOB_KEY will be equal to 2, and we indicate to the job that it should check for statuses of the previous job (in which JOB_KEY = 1).
- The job starts by checking the status of the flow A in the table FLOW_STATUS with JOB_KEY = 1. As the status is equal to Success, the flow A doesn't need to be run in this job. A row with STATUS = “Already run” is inserted in the FLOW_STATUS table.
- Status of flow B with JOB_KEY = 1 is “Failure”. The flow B should accordingly be executed during this job. The job then checks the status of the prerequisite (the flow A) for JOB_KEY = 2. It turns out that the flow A was already run, so flow B is allowed to run. It runs successfully. A row with STATUS = Success is inserted in the FLOW_STATUS table.
- Remaining flows follow a similar logic.
Below are the rows inserted in the FLOW_STATUS table during this job execution.

As you can see, this solution manages the ETL dependencies, keeps trace of the load history, and allows easily a partial re-run of the ETL if a part of it failed. In the next part I’ll give you the details of the Data Services implementation: which scripts/flows/functions/etc. shall we use? How do we make this system easy to implement and maintain? Until then, I’m looking forward to your opinion on this proposed architecture. Does it look good? How would you improve it? Let me know with a comment below.
Introduction to CMC Monitoring in SAP BO4 SP4
A few months ago a client asked me about how to be aware about problems (disconnections) in the different servers and services of their SAP BO4 SP4 without needing a person to constantly check the status. I then started to research about the monitoring feature in the CMC. The truth is that there isn't too much information about it in the documentation, just some pages in the Platform Administrator Guide, or posts or references to this topic around the web. With this post, I will try to compile all this information I have found and will explain the use of these interesting features and give you a brief introduction to CMC Monitoring.
First of all, let me explain what is CMC monitoring: Monitoring is a new feature of the CMC that appears with SAP BusinessObjects 4 and allows Administrators to see the use and health of the BO system. For this, it uses watches, probes, metrics and alerts. There are some default ones, which allow the Administrator to start playing around with monitoring without a huge knowledge on the topic and obtain really useful information about the status of the system. Before using this feature we need to know the actions we must perform and the existing limitations.
Also, we must ensure the information for monitoring is stored in the Monitoring database. This is a Derby database and it works independent from the other two DBs in SAP BusinessObjects. To activate the Monitoring database we need to log into the CMC, and go to Applications, and double click on the Monitoring Application. This will open the Properties window of the Monitoring Application. Make sure that “Enable Monitoring Application” is checked. Click Save and Close. The final step is to restart the Adaptive Processing Server (APS) if it was not checked. The information in the DB is deleted every time we reach 1GB of information. We can increase that size in the CMC.
Monitoring
To reach the monitoring section in the CMC, we need to go to Applications > Monitoring
Monitoring default view
As we can see in the above image, there are 5 different tabs in this section: Dashboards, Metrics, Watchlists, Probes and Alerts. Let's run through each one:
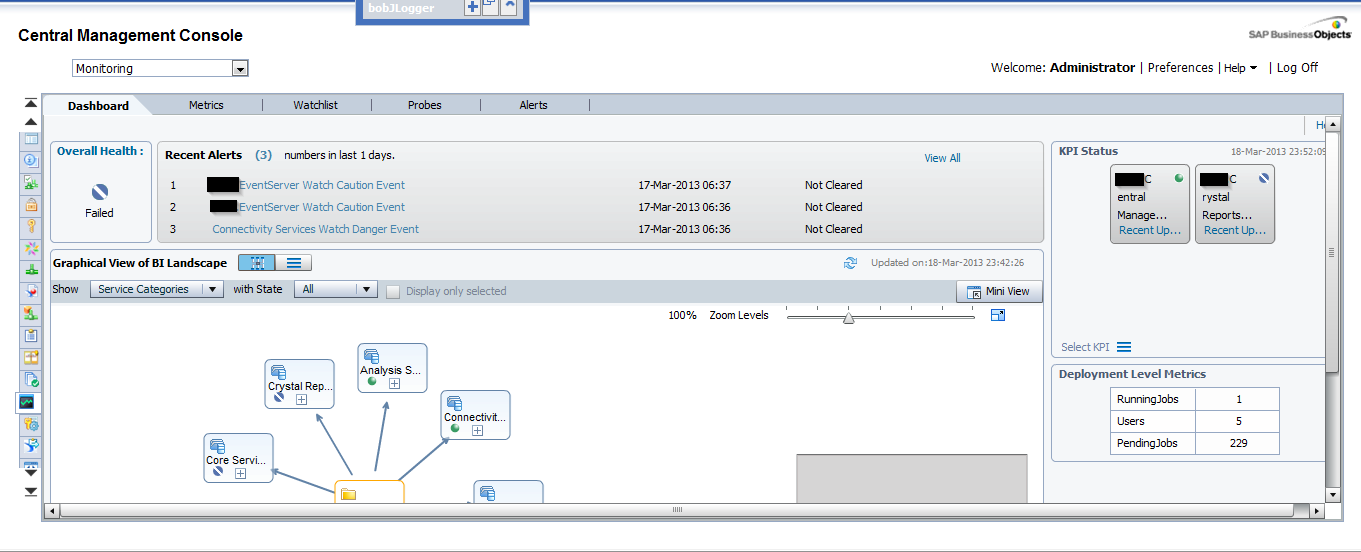
1. Dashboards
it is the default tab and as the name says it is a dashboard which is divided in 5 parts:
- Overall Health: It is an icon showing if the BO is working correctly or not.
- Recent Alerts: Here we can see the alerts triggered the last 24 hours by the system.
- Graphical view of BI Landscape: this panel includes a graphical or tabular view of the Watches within the system .We can drill down click in them.
- KPIs Status: This part displays three Key Performance Indicators for the system. We also can drill down clicking on them.
- Deployment Level Metrics: we can see 3 interesting metrics as the running jobs, the users and pending jobs.
2. Metrics
Metrics are individual pieces of information that contribute to know the health of the different components of the system.

Metrics image
Metrics are used to measure the health of a component. The metrics we define will depend on the components we are monitoring and our requirements. Examples of metrics are user login time, query execution time, CPU usage percentage, availability status for a system service, etc. We can use them in Watches and Alerts, setting thresholds for Warning and Danger alerts. There are around 250 predefined metrics. Furthermore, we can create our own metrics if we think they are necessary. Normally, with the default ones, we can check the status of almost everything in the system.
If we select a metric, we can observe the historical and current status of it.
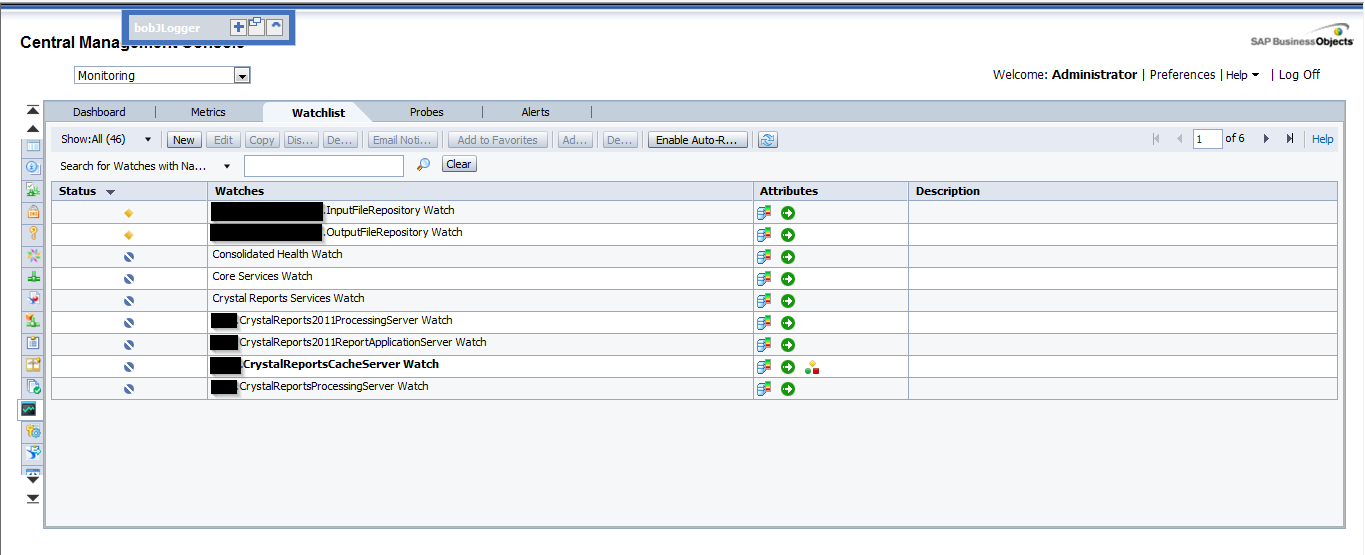
3. Watchlists
This tab lets us monitoring the watches that we have created. The watches are thresholds for metrics that show us if the metric is on a healthy, warning or in danger status.
Watchlists image
Again, we have created watches by default. We can change these thresholds to adapt them to our system. Also, we can create notifications to the watches, hence, we can ask the watch to send an email if the system is in danger, for example. There are a lot of interesting options with the watches. I encourage you to try them by yourselves.
Finally, we can decide which are the watches that we want to see in the dashboard tab.
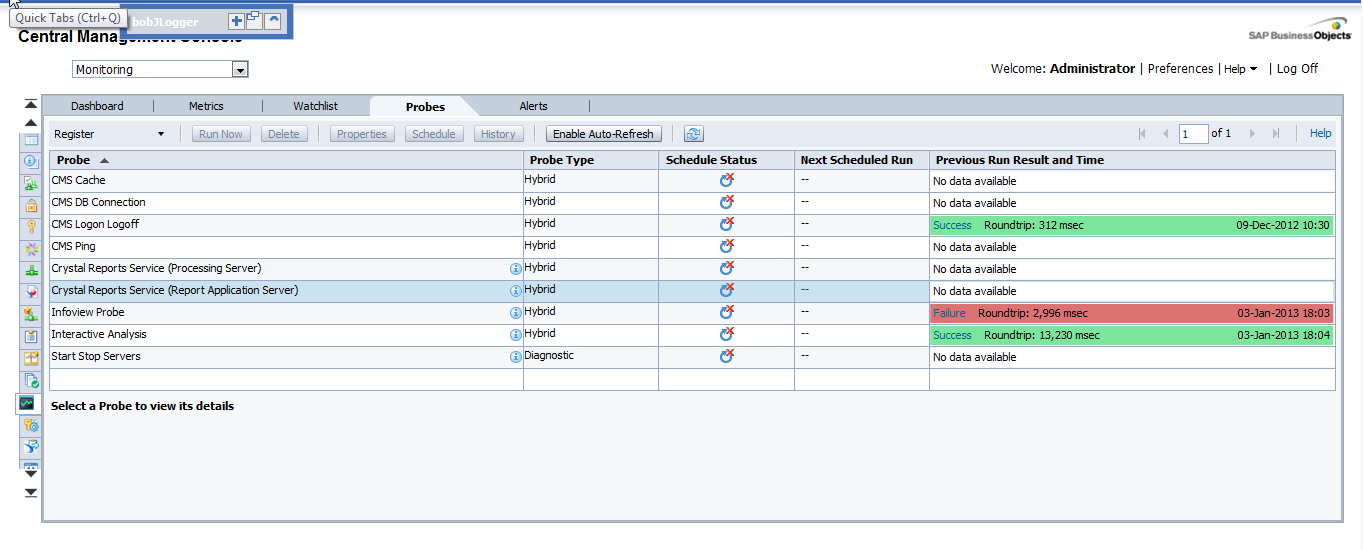
4. Probes
They provide us the ability to monitor our SAP BusinessObjects system, using simulated application work-flows which are run through SDK-based scripts.
Probes image
This is the most interesting part of the CMC monitoring but, at the same time, the most difficult. As we can create probes with a SDK, the power of this tab is huge. We could create whatever we want, but it is not very easy to create these probes. There are not examples around the net or they are very difficult to find. (I will try to add another entry in this blog in the future with an example).
As I mentioned before, the system will provide default probes. We can choose among 9, which are:
- CMS Logon Logoff probe: Monitors if a user can successfully log on to the SAP BusinessObjects system and how long does it take.
- Crystal Reports service through Page and Cache Server probe: Monitors the availability and performance of the Crystal Reports service (through the page and cache servers).
- Crystal Reports service through Report Application Server probe: Monitors the availability and performance of the Crystal Reports service (through RAS).
- Infoview Probe: Monitors the availability and performance of logon/logoff the InfoView web application.
- Web Intelligence Service Monitoring probe: Tests the availability and performance of the Web Intelligence Service through the report servers.
- CMS Ping probe: Tests the core functionality of the CMS.
- CMS Cache probe: Tests the availability of the CMS cache.
- CMS Database Connection probe: Tests the connection to the CMS repository.
- Start and Stop Servers probe: Tests to start and stop the different servers of the system.
5. Alerts
Here is where all the Alerts that we have set up in the Watchlist will appear.

Alerts image
This is a list of the alerts that the system raises. We can see the different details of the alerts when clicking on them. These alerts also can send emails and perform actions, depending on what we have set in the watchlist.
How to use all in one
With all the above information, I have explained an overview of the different tabs of the monitoring and also what we can do with each one of them.
If we want to tap the full potential, it is easy to see that all the tabs are connected and we need to use them all. One nice example could be monitoring the response time to open a report in the system. For this, we use the probe "Web Intelligence Service Monitoring" that logs in and we try to open and refresh a report in Web Intelligence. After this, we use the metric of the time that takes to the system to execute the probe and the metric that says if the probe was successful or not. Also, we create a whatchlist with this metric and if the probes takes more than 5 seconds, it will send an email advising the Administrator that the system is working a bit slow and if the probe fails or takes more than 15 seconds, it will send another email advising that the system is not working properly. We can schedule this probe to be executed on a daily basis.
With this simple scenario we are able to detect any problems in the system automatically, before any user reports it. Moreover, the tabs' alerts will show us if there is something wrong that we had not noticed before.
Conclusion
As a conclusion, we can see that by playing around with all of these features, we can accomplish really interesting things and get most everything under control in our BO system. It could appear difficult to learn, but there are a lot of things that we can do just with the default settings. After you get used to them, it is time to play with the power of the self-created probes and add more personalized options to our monitoring.
I hope this introduction to monitoring has helped you to understand a bit more how CMC Monitoring works in SAP BO 4 SP4.
If you have any questions or suggestions, please leave a comment below.
Using a Java Application as a Source of information with SAP Data Services
After my post on how to Use Data Services SDK libraries to construct an AWTableMetadata in a Java application, in this post I will explain how to access a JAVA application as a source of information by using the WebService DataStore in SAP Data Services.
To do this we need:
- Tomcat Server (where our service will be allocated Tomcat 6 BI4)
- Axis2 Library (1.6.2)
- Standard Binary distribution/zip
- WAR distribution/zip
- Eclipse (To construct our web Service)
- Data Services Sp3
1. Building the web Service
Step 1: Unzip the the Axis2 WAR distribution inside of the folder…SAP BusinessObjectsTomcat6webapps replacing the actual Axis2 folder by default.
Step 2: Unzip the binary distribution of the Axis2 into a folder called Axis2 (C:Axis2axis2-1.6.2).
Step 3: Set system AXIS2_HOME variable. Go to Control panel -> System -> Advance System settings-> push the Environment Variables button and create the new one with this specification:

Step 4: Set up CATALINA_HOME variable. This is where the Apache Tomcat folder will be located. Go to Control panel -> System -> Advance System settings-> push the Environment Variables button and create the new one with this specification:

Step 5: Restart the Tomcat 6 Server. (turning off our BI4 installment during this process is recommended)
Step 6: Inside Eclipse right click to export our java application into a JAR File.

Step 7: Set the Export destination to the follow path:
…SAPBusinessObjectsTomcat6webappsaxis2WEBINFservicesOURPROJECT.aar
Where “OURPROJECT.aar” will be the name of our web service with .aar extension.

Step 8: Restart the Tomcat. Once Tomcat has started we have to access to this path http://localhost:8080/axis2/services and we should see this window:

Step 9: Click on our service in this case Clariba_SMT. We will redirect to the following URL:
http://localhost:8080/axis2/services/Clariba_SMT?wsdl
Copy this URL into a notepad for setting the Web Service Data Store.
2. Setting the Web Services Data Store in Data Services
Step 1: Open the Data Store perspective and right click with the mouse and select New.

Step 2: Set the new name of our extractor as “WS_ClaribaSMT” and then put the URL where our web service is located. Data integrator needs the WSDL descriptor so we put http://localhost:8080/axis2/services/Clariba_SMT?wsdl

Step 3: Import the functions from the webservice that we are going to use. We select in this example“getTableTweeetsEN” for English and “getTableTweeetsES” for Spanish language.

Conclusion: Now we are ready to use our Web service as a Function Call inside a transformation in a Data Services Data Flow. Keep in mind that our Java Application has to return a type of value that Data Services can interpret easily for example a Table (See my past blog for more information). Subsequently we have to do a special set of transformations to interpret the information of the Web Services, which I will cover on my next post.
If you have any related tips or suggestions, please leave a comment below.
Providing SSM data to SAP BusinessObjects reporting tools - Exhausting all scenarios
In the last two months I have been in a couple of customers who were interested in the integration of SAP Strategy Management 10.0 with SAP BusinessObjects BI Platform 4.0. In this post I would like to explain what that integration is about.
First of all, a brief introduction about the solution. The SAP Strategy Management (SSM) software allows aligning the Strategy Plan of the company and its key objectives and spread it across all the organization. It is an out of the box Enterprise Performance Management solution in which you can insert the most important KPIs of your company in Balanced Scorecards or Strategy Maps and control their performance in relation to the Strategy of the company. Within SSM you can also create initiatives to implement improvements or corrective actions and link them to the objectives or KPIs.
Sometimes the customer has requirements to implement reports or further analysis on top of SSM and these cannot be covered with the standard functionality of the solution. In that case, the best option is to implement the integration between SSM and SAP BusinessObects reporting tools. Some examples of what you can do with that integration:
- Implement bespoke Dashboards with your SSM KPIs and Objectives
- Implement universes and allow users to exploit information from SSM with Web Intelligence without consuming additional SSM licenses
- Implement pixel-perfect Crystal Reports on top of the SSM
- Foster ownership with Publications. For example, send a list of KPI’s that are not performing well to their responsible users
For implementing such integration, you can follow the SAP SSM Configuration guide. However, in some cases, there is lack of documentation and you have to do things outside the script. In other cases, the existing documentation has not been updated yet to BI 4.0 and SSM 10.0. And finally, sometimes the documentation is wrong or the software has bugs and you cannot setup the integration.
In this post we will analyze following scenarios:
- Web Intelligence reporting on top of a SSM Models
- Web Intelligence reporting on top of a SSM Data Model (Clariba-developed solution)
- Crystal Reports on top of SSM (exploring different options)
- Dashboards on top of SSM (exploring different options)
These scenarios have been implemented with following software components:
- SAP NetWeaver 7.3 SP08
- SAP SSM 10.0 SP06
- SAP BusinessObjects BI Platform 4.0 SP05
- Crystal Reports 2011 SP05
- Dashboards 4.0 SP05
1. Web Intelligence reporting on top of a SSM Model
As per SAP documentation, we can setup the ODBO Provider in order to build a Universe on top of SSM Models. The problem is we still have to use the Universe Designer instead of the Information Design Tool of the BI 4.0. Bellow are the steps for setting up the ODBO Provider and implementing your first report on top of the SSM:
- Go to your BO 4.0 server and make sure you have a Multimensional Analysis Service in the BO server. Stop the MDAS Server and the Connection Server in the Central Configuration Manager
- Copy the ODBOProvider folder from the <drive>:Program files (x86)SAP BusinessObjectsStrategy ManagementInternetPub path of your SSM server to the BO server
- In the SSM server, run the SSMProviderReg.bat file in the BO server. Make sure you have administrator rights in the BO server. Once completed, check in the regedit that you are able to find the register SSMProvider.1 in the Windows register
- Modify the windows register to insert following string in that path (assuming that you are using a 64-bit Windows): HKEY_LOCAL_MACHINESOFTWAREWow6432NodeSAPSSMODBOProvider "servletUri"="/strategyServer/ODBOProviderServlet"
- Access the following path in BO server: <drive>:Program Files (x86)SAP BusinessObjectsSAP BusinessObjects Enterprise XI 4.0dataAccessconnectionServeroledb_olap
<DataBase Active="Yes" Name="Strategy Management 10.0">
<Aliases>
<Alias>Strategy Management 10.0</Alias>
</Aliases>
<Library>dbd_sqlsrvas</Library>
<Parameter Name="Family">SAP BusinessObjects</Parameter>
<Parameter Name="Extensions">sqlsrv_as2005,sqlsrv_as,oledb_olap</Parameter>
<Parameter Name="MSOlap CLSID">SSMProvider.1</Parameter>
</DataBase>
- Start the MDAS Server and the Connection Server
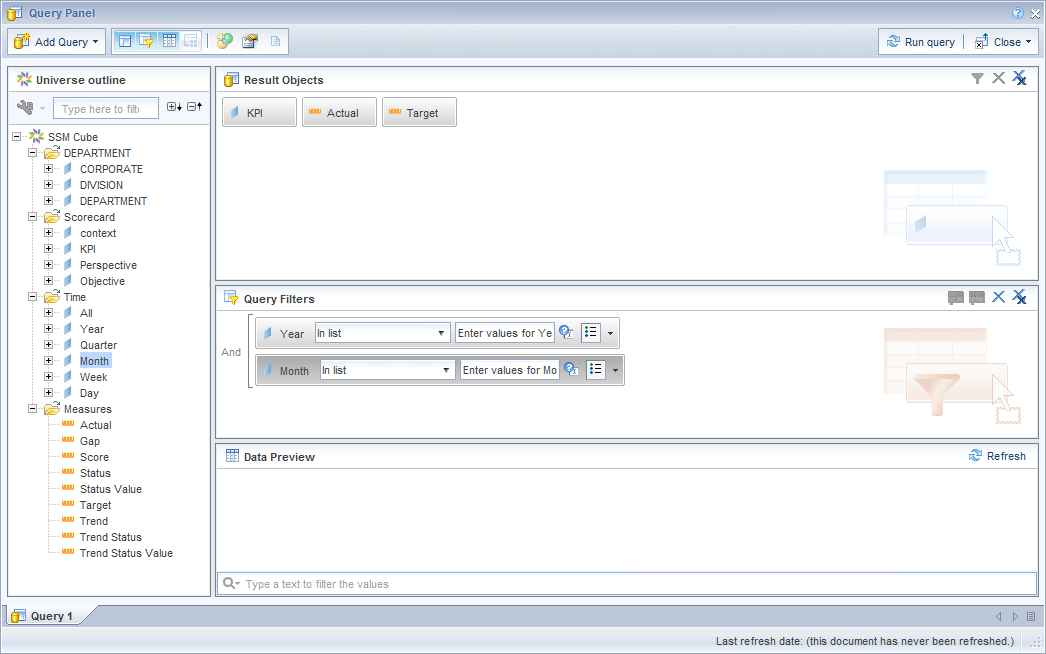
- Now we can go to the Universe Designer and start implementing a Universe on top of our Model. The first step is defining the connection. In the connection list (retrieved from the Connection Server) we can see now the new register we have inserted, Strategy Management 10.0:
- Define the connection parameters. You must be an SSM user with proper permissions and you must inform the server's complete address (FQDN) and its port.


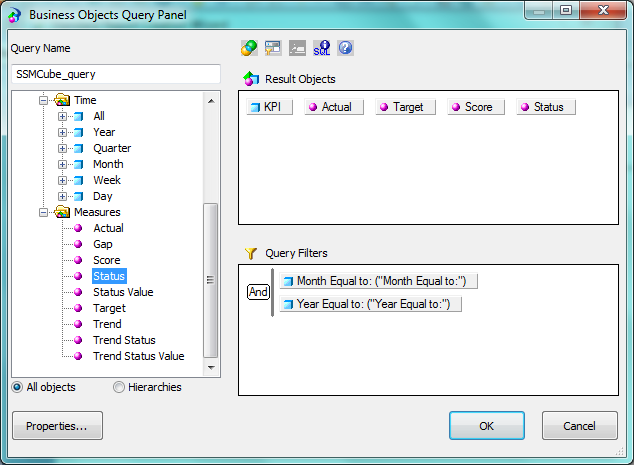
- Once connected to the SSM server, you will see the list of available Cubes. The AS category allows access to the measures (based on attributes and dimensions) in the Application Server model.The SM Adapter allows access to the strategy dimension, which represents the strategy management dimensions Scorecard and Initiative. Scorecard detail not relating to the KPI such as comments are not presented.

- And finally we will see our universe with the available dimensions, the standard classes (Time and Scorecards) and the measures. You can display the technical names of the objects as detail or you can define hierarchies of Perspectives, Objectives and KPIs.

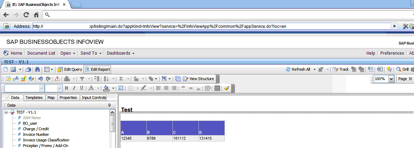
- Now we can publish the universe and go to the Web Intelligence to start implementing our reports on top of the SSM models.
2. Web Intelligence reporting on top of SSM Data Model
That is a solution you can implement if you have an advanced knowledge of the SSM Data Model. You can implement a UNX Universe with the Information Design Tool by linking all the tables of the Entry and Approval, the Nodes of the Scorecard, the Cube Builder or the Initiatives. The advantages of that option is that you have access to extra information not available in the SSM Cube, such as the Initiatives, the users related to specific KPIs, the attributes of the KPIs etc.

If you are interested in such an option, please, contact us. Keep in mind that it is not a supported option from SAP but we have implemented it many times and we know it works.
3. Crystal Reports on top of SSM
The integration of SAP Crystal Reports with SSM can be done by 4 different ways:
- Implementing a Query as a Web Service from the Universe, built in previous steps: we have managed to implement that scenario
- Connecting Crystal Reports to the Universe on top of the SSM Models we have built in the first step: that scenario is not working although we followed the instructions from SAP
- Using an OLE DB (ADO) connection: this option, not explained by SAP, is available if we install the ODBO provider but we have not managed to make it work

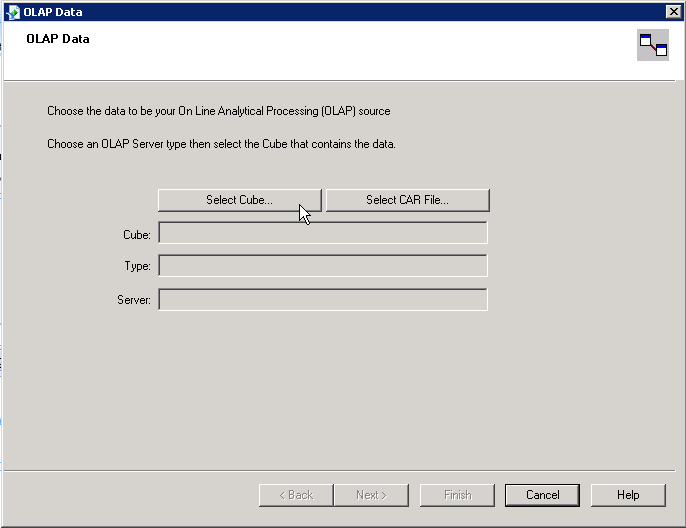
- Using the OLAP Connection: according to SAP Documentation, we can build an OLAP Cube Report in Crystal Reports. We should be able to select the Strategy Management option in following screen to inserts SSM connection data, but we have not been able to find that option

4. Dashboards using Web Services Connections
Using Dashboards, you have two different ways to implement the access to data:
- Implement a Query as a Web Service (QaaWS) to retrieve the relevant information from the Universes we had implemented before.
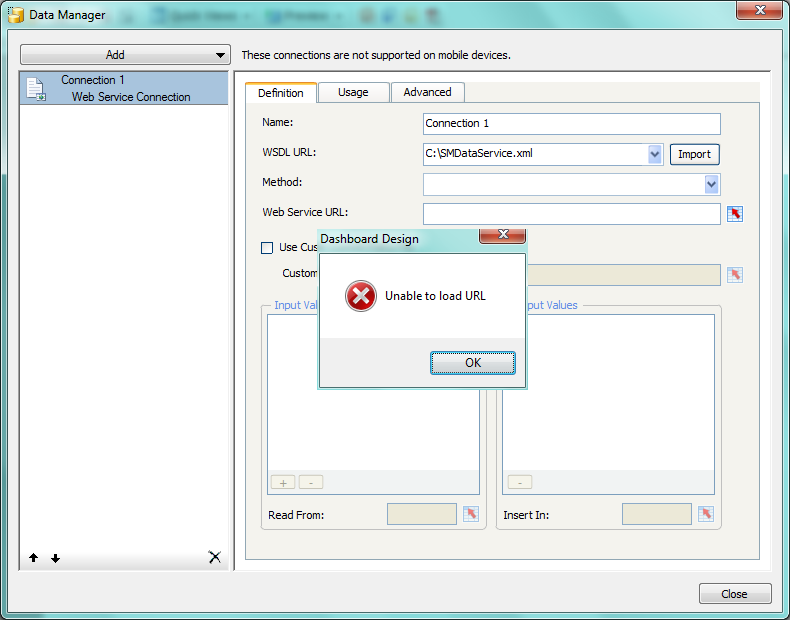
- Use Web Services available in the SAP NetWeaver to retrieve information from the SSM: according SAP documentation you need to download the WSDL file SMDataServiceService and CubeServiceService applications and call the functions within them. With our Dashboards 4.0 SP05 we have not been able to process the WSDL files as the tool is unable to load the URL.
Summary
Providing SAP Strategy Management information to SAP BusinessObjects BI Platform 4.0 can enhance the capabilities of your Strategy system. However that integration is not so easy given the lack of information on that topic and the quality of the existing information. We tried to implement all possible integration scenarios and we have succeeded with Web Intelligence and this is the route we recommend as the scenarios related to Crystal Reports and Dashboards the integration were not working when using SSM 10.0 and BI 4.0.
We will be following-up these issues and let you know if we finally manage to solve them. If you have any suggestions or if you found a workaround to these issues please leave a comment bellow.
Using Google Chrome with SAP BusinessObjects
We all know that there are many internet browsers available, but definitely Google Chrome is one of the most used nowadays and therefore we have had a lot of feedback from our customers related to using chrome with SAP BusinessObjects.
A main problem found by users is that when using Google Chrome on InfoView or BiLaunchPad a missing plug-in error screen appears when you are trying to modify a report and it also shows a HTTP Status 500 error screen when trying to log in to SAP BusinessObjects Explorer. In this blog I will provide a solution these issues.

Issue when login to InfoView or BILaunchPad in GoogleChrome

Issue when accessing SAP BusinessObjects Explorer
The solution we have found is to use a Google Chrome add-on called “IE tab”, which emulates Internet Explorer on Chrome.
Steps to install it:
- From Google Chrome, introduce the link in the url bar and install the add-on. https://chrome.google.com/webstore/detail/hehijbfgiekmjfkfjpbkbammjbdenadd
- Once installed you will see a small folder with the IExplorer logo on the top right corner of google chrome.
Folder with Explorer logo
- Click on the folder and another url bar will appear

URL bar appears
- Introduce the Infoview / BI LaunchPad link in the new bar and start working with it.
Moreover, in case you need to click on an Open Document link and you want Google Chrome to be opened up automatically with it you will need to add your server’s url so it can open successfully, for this you need to follow these steps:
- Right click on the small folder with the IExplorer logo
- Choose Options
- Add the server’s address text in the Auto URL’s field
The outcome
SAP BusinessObjects web based applications can be successfully used with Google Chrome, see below the following examples:
Modifying a report on InfoView

Viewing and managing spaces from SAP BusinessObjects Explorer
Summary
The main benefits of applying these tips are, with the help of Google Chrome:
- Modify documents on Infoview / BILaunchPad
- Log in and manage spaces in SAP BusinessObjects Explorer
- Increase the speed of navigation while going through the platform folders
According to the SAP’s official PAM (Product Availability Matrix), Google Chrome is not entirely supported due to its fast development speed, so the use and frequent update of this add on is highly recommended.
Hope this will help you have a better experience when working with SAP BusinessObjects. If any doubts or suggestions please leave a comment below.