
The main difference between the new Live Data Connector 3.1 and previous versions is the ability to access and use data stored in SAP BusinessObjects WebIntelligence.
Users can make calculations using all the measures, dimensions and variables available not only from a Universe, which was the main feature until now, but also from a WebI document. It’s therefore now possible to use a Universe or a WebI document in a very similar way, utilizing the same Live Connection in SAP Analytics Cloud.
This connector is both very simple and very powerful, reducing the development time of new visualizations in companies with large pre-existing data infrastructures. From a cost perspective, companies can protect the investment already made in their Universe and WebIntelligence reports, as they remain compatible.
The key feature is the ability to connect live to data stored on-premise, without that data ever being uploaded or transferred outside the secure on-premise environment. All data remains behind your organization's network firewall.
This enables those companies that still wish to keep their data on-premise (for reasons such as security, infrastructure or lack of resource) to move to a hybrid or 100% cloud environment. In turn, this gives them access to new features including planning and smart features that employ predictive technology and advanced machine learning algorithms.
Configure
The software versions required for the use of the connector are:
SAP Analytics Cloud: 2020.21
SAP BusinessObjects: 4.2 SP7 or higher
Most of the installation process is described in the following article: The Path to Hybrid SAP Analytics: Did you know that you can connect SAP Analytics Cloud and SAP BI Platform in under 20 minutes?
The above article is valid for the connection to Universes, but there are some additional simple steps to follow before you can also gain access to the WebI information from SAP Analytics Cloud.
Create a new LCD category
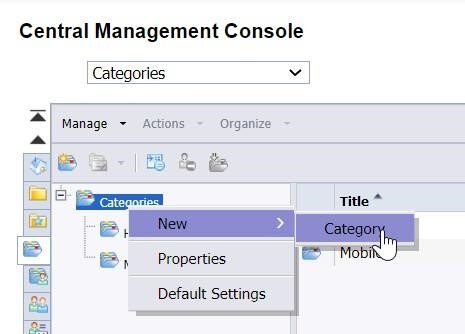
From SAP BusinessObjects Central Management Console LaunchPad 4.3 in the dropdown menu there is an option titled Category. Once there, choose Categories > New > Category.
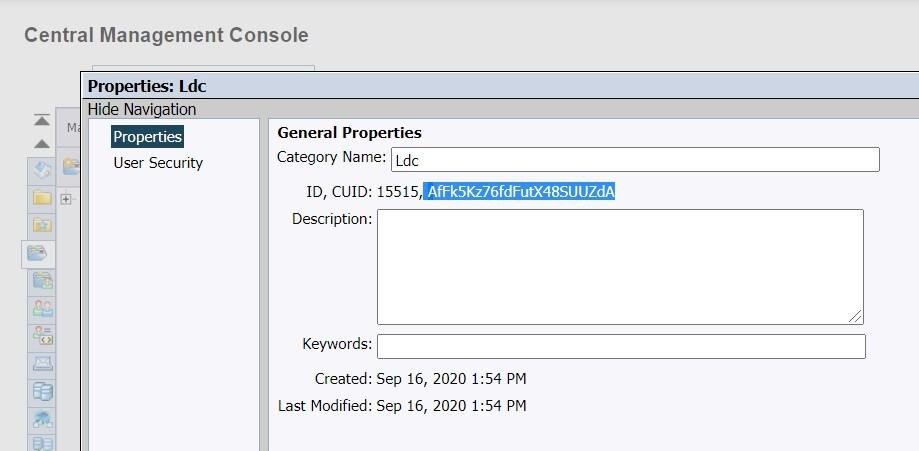
Then, on the category properties screen, the CUID shown must be typed in the LDC.properties file
boe.webi.category.cuid=AfFk5Kz76fdFutX48SUUZdA
Also, the next parameter must be set to True in the LDC.properties file. With this parameter, personal folders are included when searching for WebI documents.
boe.webi.includepersonalfolder.bool=true
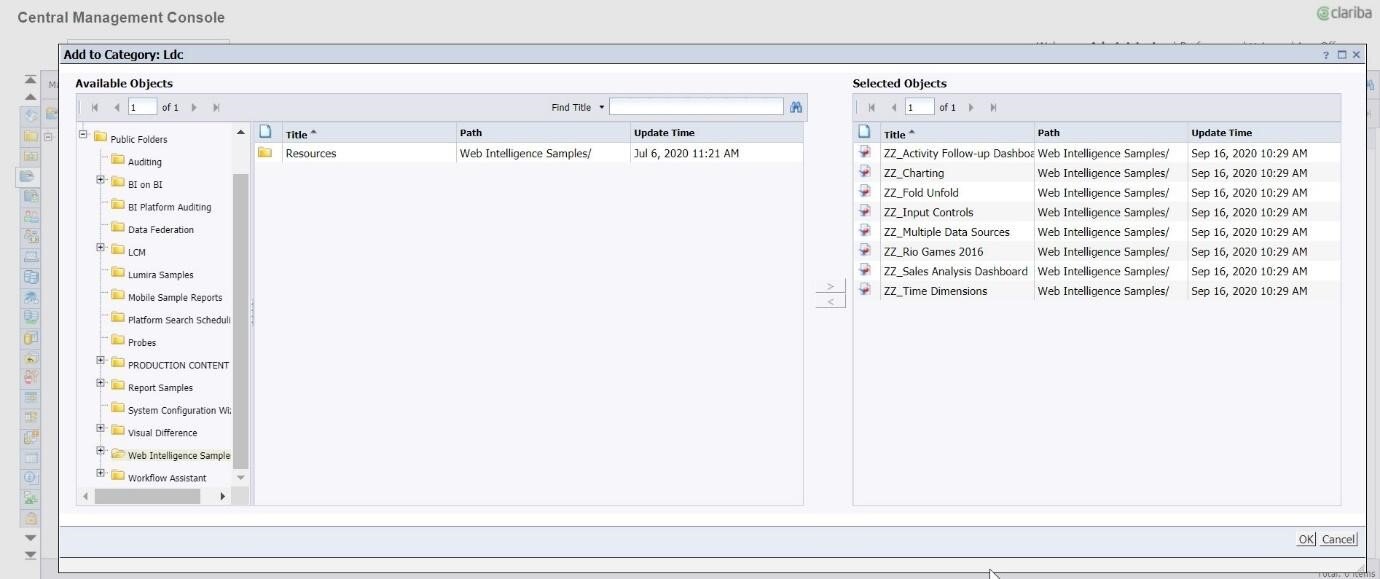
Assign WebI documents to this category
Click on the Category Created > Add To Category and choose those WebI documents you want to make visible in SAP Analytics Cloud.
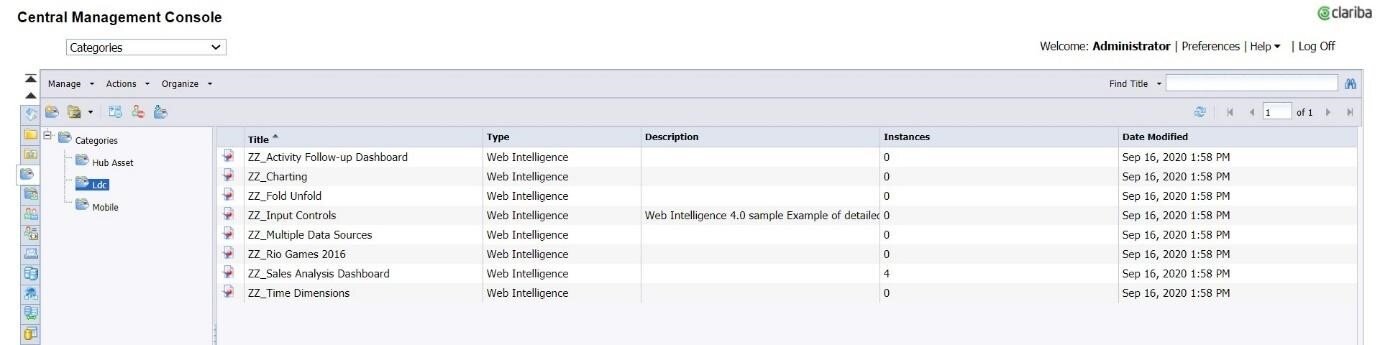
Once saved, they will be shown in the Categories main menu.
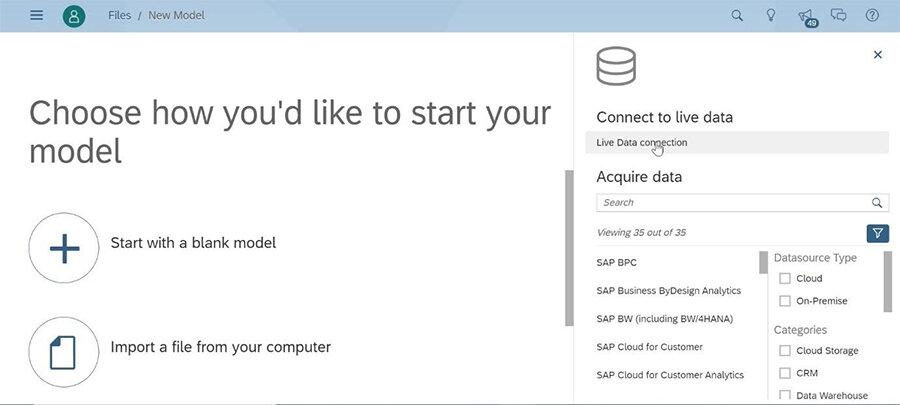
Create a model
Now let’s create a new model from SAP Analytics Cloud. Click Main Menu > Create > Model and then choose the option Live Data Connection.
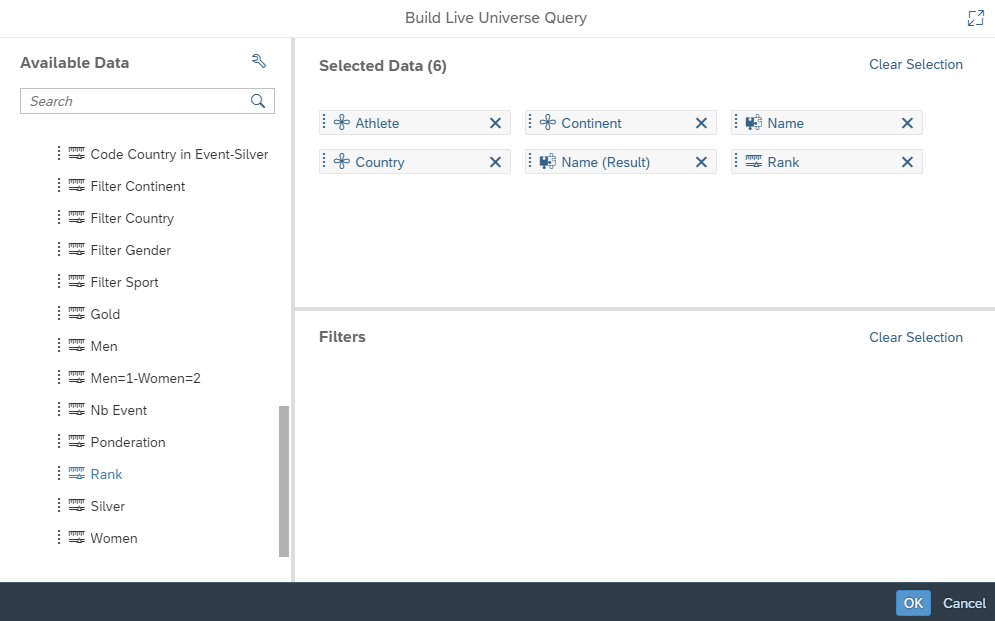
Where it offers System Type, we click on SAP Universe, choose the connection previously defined and then set the credentials.
Now we can see a list with the Universes at the beginning and the selected WebI documents at the end.

If you click into one of them, you can see all objects available from that WebI document. Then you must drag and drop those that are going to be used, press OK and then save the model.
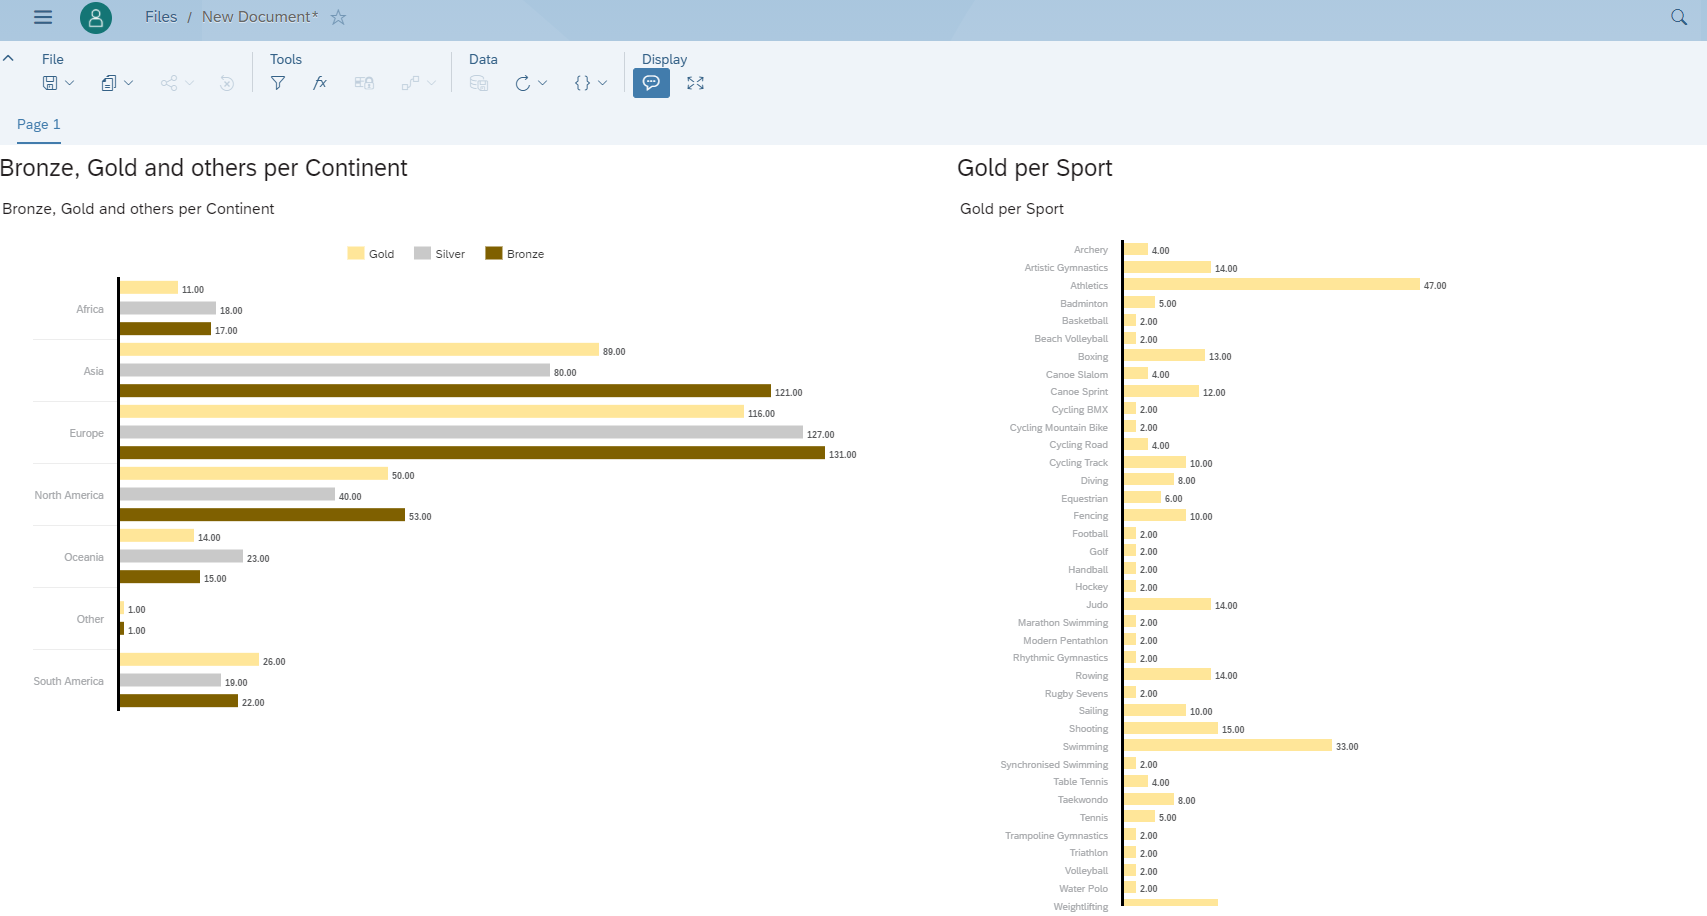
CREATE A STORY
Once the model has been saved, let’s create a story using the data from that model to show a couple of simple bar charts:
If we save the story, log out, log in again, and try to access the story again, the SAP BI platform credentials are requested again, because data has not been stored in the cloud. Instead, it refreshes the data in real time, preserving your security.
CONCLUSION AND BENEFITS
The biggest advantage of this new version of the connector is the possibility to leverage WebI queries so that pre-existing dimensions, measures, hierarchies, variables and merged dimensions can be reused, saving in both time and cost.
Exporting WebI report components like tables or charts is not the main intent, but it is possible to reuse a calculation with complex logic stored in a variable. For example, instead of reusing a geographical bubble chart coming from WebI we will need to rebuild the graphical part. It will be straightforward to do so, however, as the necessary objects will be already prepared, like Latitude, Longitude, Country, etc.
A deeper understanding of the WebI data models and the way they currently work can be found in this article: https://www.clariba.com/blog/20201022-the-path-to-hybrid-sap-analytics-using-webi-data-models-lluis-aspachs
Review the linked post to get a better idea of which WebI data model option is more suitable for your business.
We hope this article has helped you in starting to build your hybrid analytics model. If you have any questions, please drop us a comment!