In this article, we’ll walk you through the process of creating virtual data models in SAP Data Warehouse Cloud to make your data easily available to business users.
In the series so far we have covered various topics such as space management, setting up your connections, building integration processes with Data Flows, and preparing your data. In this piece, we will explain the foundation of Data Modeling concepts and how these principles are applied in the SAP Data Warehouse Cloud.
What is Data Modeling?
Data Modeling is the key to how we get and store our data and provide actionable insights to business users in SAP Data Warehouse Cloud. Depending on the data modeling techniques you use adaptability and performance can vary greatly.
The definition of a data model is the way you structure all your data specifying the different relationships between all of the elements. This structure must align with your business needs in terms of query performance and the ability to create analytics on top, as well as making it scalable and easy to maintain.
Before commencing your data model, you must identify what the business questions you’re trying to answer are, and list all the elements related to them.
1. Facts, Measures, and Dimensions
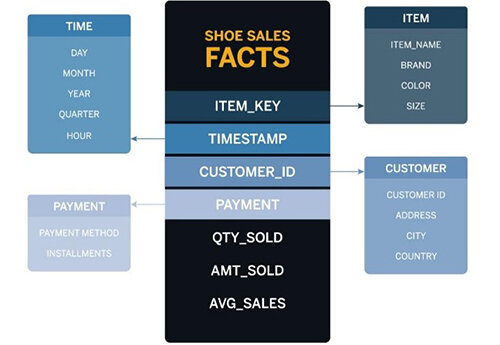
As mentioned before, the data model will contain facts, measures, and dimensions. A fact is the part of your data that indicates a specific occurrence or transaction, like the sale of a product or receiving a shipment of a certain number of items from a supplier. Note that a fact is composed of multiple measures, these can be qualitative, like a Product SKU, or quantitative, like the price of a product. The qualitative measures can be then linked to specific characteristics of that measure, which are called dimensions.
Dimensions are pieces of data that allow you to understand and index measures in your data models. Dimensions are either characteristics of a measure or pieces of data that help contextualize the fact.
The separation between facts and dimensions has an impact on your data models and how their graphical representation looks. For example, a simple star schema of Best Run Shoes would look something like this:
2. Types of Models
In SAP Data Warehouse Cloud, you can build logical and physical data models:
Logical data models allow you to determine and connect specific attributes of data. For example, this is where you would make sure the data about your customer is complete with full name, street name, city, country, and ZIP code, among other data points about each customer.
Physical data models determine how the data is physically stored, for example, in which drive it is stored.
Data Models can be simple or complex depending on your business needs. SAP Data Warehouse Cloud provides you with the flexibility to choose between SQL queries or graphical views.
3. Entity-Relationship Diagram
This is the first step to start data modeling, here you will define all elements and entities and define the relationship between all of them. This is what we call an Entity Relationship Diagram (ERD). For example, Product, Supplier, Address, etc…
The basics elements in an ERD are entities, attributes, and relationships.
4. The Data Builder
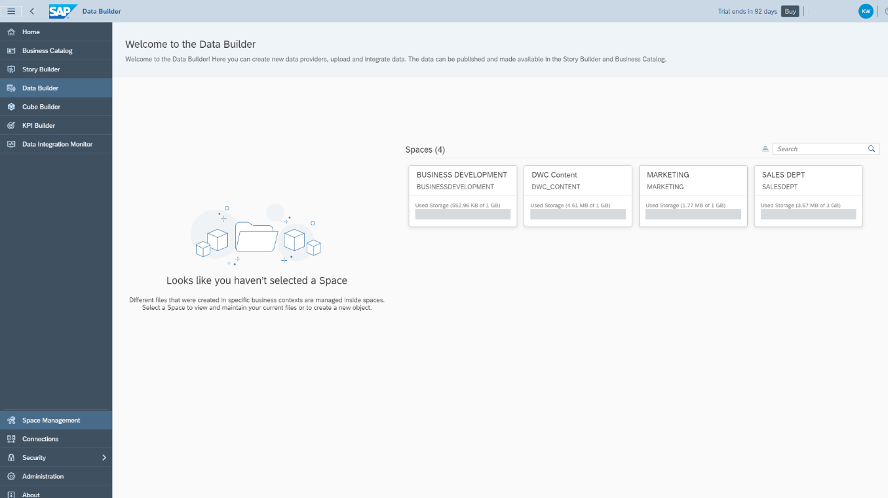
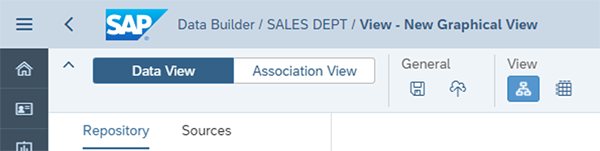
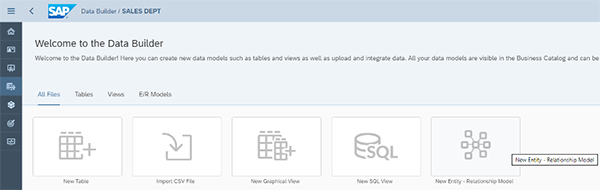
In SAP Data Warehouse Cloud, start with the Data Builder and select the Space in which you want to model your data.
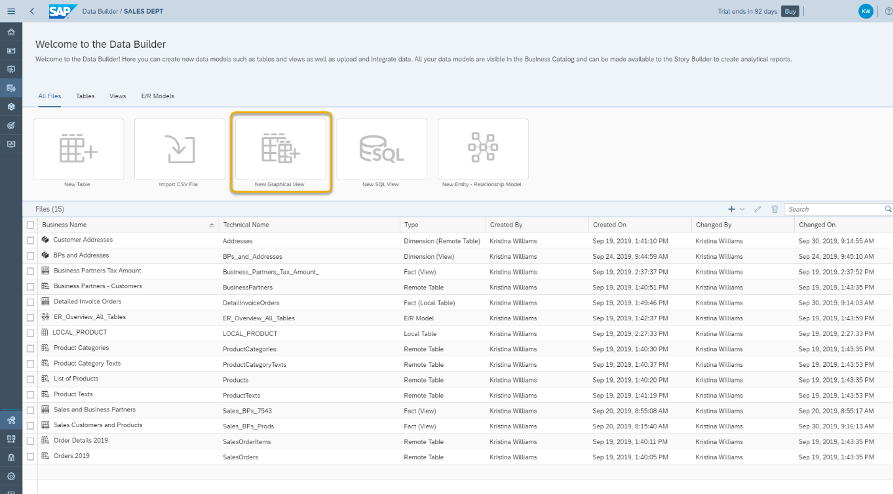
Then, click on New Graphical View.
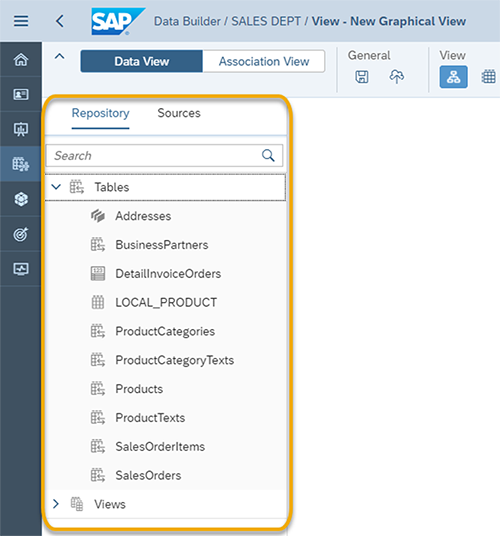
The next step is to use the left side panel to select your data sources. You can either use the data already in the Repository of this Space or select from the Sources connected to this Space.
4.1 Start Modeling
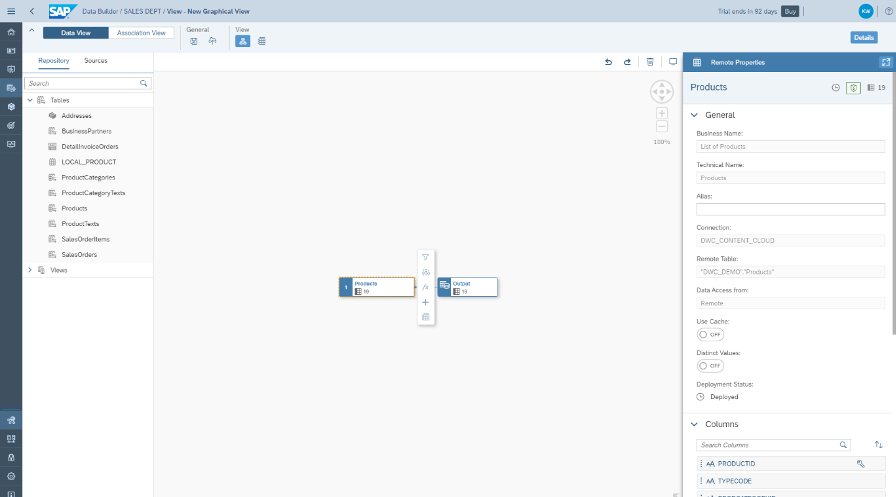
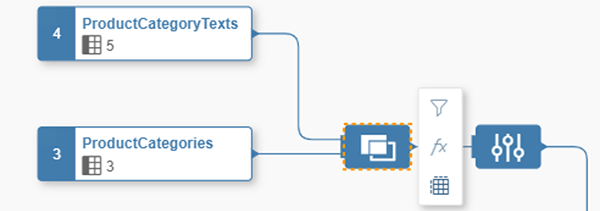
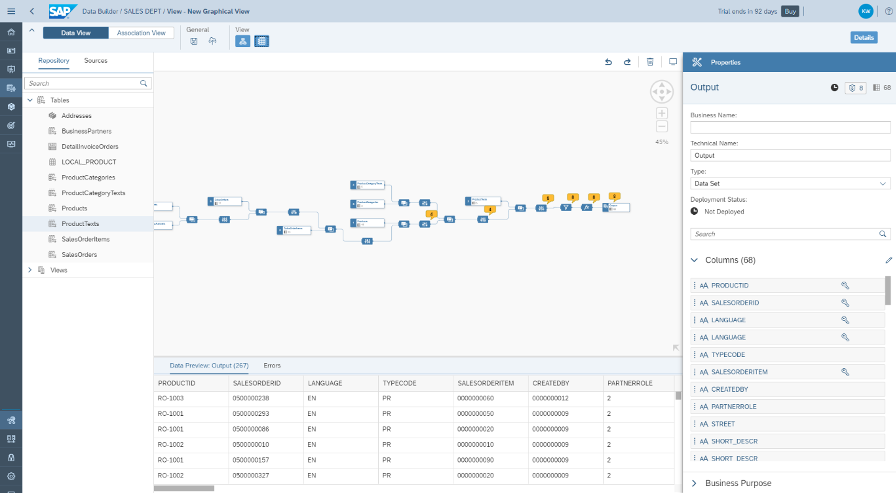
To start modeling your data, select a table or view, click on it, and drag it to the canvas in the middle of the screen. Once you drop it on the canvas, an Output node will be automatically created and linked to the table or view you dragged to the canvas.
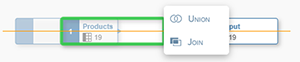
You can now drag and drop other tables or views on top of the one already on the canvas. As you drag the first table or view, you will see a pop-up listing Union and Join.
This is your opportunity to choose to make a union of these tables, which would mean an output with the complete contents of both tables or views. If you don’t specifically choose a Union, all tables and views will be joined by default. You don’t have to specifically choose Join, just drop the table and it will automatically be a join. Once you have your first join, you will notice that the canvas rearranges itself to show a Join node and a Projection node. If you click on the Join node, you can see the right sidebar shows details of this join, including which columns are mapped together. You can either change the type of join or change the mappings between the two tables.
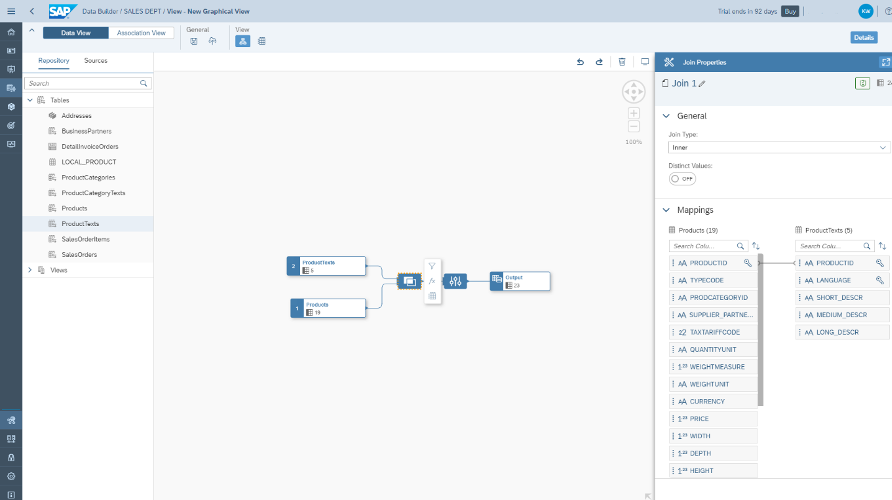
If you want to delete an existing mapping, just click on the line between the two columns and then click on the trash icon in red.

After you add all of your data sources and determine the ways in which these tables or views are connected (or joined), you might notice some yellow alerts on top of some of the Projection nodes.
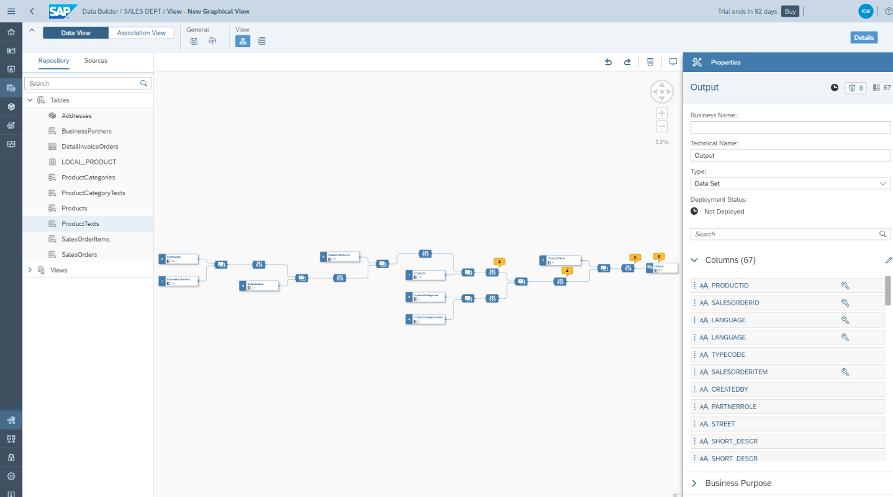
This usually means that your join includes some columns which have exactly the same technical name. You can click on one of the Projection nodes with a yellow alert, then click on the shield icon to see what the issue is.
To solve this issue, you can either rename or hide a duplicate column. If you are sure that the columns have exactly the same information, you should hide it. To do that, just click on the column name, then click on Set Hidden. If, however, the column contents are similar, but not exactly the same, you can rename the column to make sure the information is present on your output but does not create issues with duplication.
To rename a column, click on the Projection node, then click on the column you want to rename. This will highlight which table or view this table is coming from.

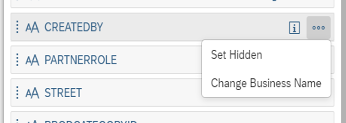
Once you are sure this is the right column from the right table, just click on the three dots icon and click on Change Business Name.
4.2 Data Transformation and Preview
If you want to make sure your data output includes only the right data, you can drill down into your data by choosing to add filters to your join, projection, or output nodes. Just click on the node you want to filter, then click on the Filter icon right next to the node.
Now you will see the Filter Properties on the right sidebar. You can filter based on columns or type in your expressions as needed. All of your changes here are automatically saved, so when you are done, just go to the next step.


Another transformation you can do with SAP Data Warehouse Cloud is to create a new calculated column and add it to your output. To start, just click on the fx icon next to the output, projection, or join node.
Then, on the right sidebar, you can select an existing column to add a calculation to and click on the pencil icon next to the column. Alternatively, you can click on the plus icon to add a new calculated column.
Again, you can use the functions, columns, and operators on the right sidebar to create your calculation.

Finally, you can see a sample of your data by clicking on the Preview Data button. This button can be found in multiple places. For example, you can click on it next to your output node. You can also click on it on the top menu, next to the Save and Deploy icons.
Alternatively, you can choose to preview just one table or one join. To do that, just click on the Preview Data icon next to the table or node you want to preview.
You will see the preview in the lower center area of the screen. Notice that you can confirm which preview you are looking at by checking the title of the preview in Data Preview: Output.
4.3 Ready to deploy
When you are finished with your data modeling and transformation, you still need to make sure to either save or save and deploy your data model. You should choose Save if you are not yet done with your modeling and still will make changes to it before using the data model in a data story.
If you’ve finished modeling, you can directly click on the Deploy icon to deploy your data model, which also saves it on your Space’s Repository. If you haven’t yet added a business and technical name to this data model, you will be asked to do so when clicking either the Save or Deploy icons. Your data model will be available for use in Data Stories if you determine it is a Fact and after you deploy it successfully.
5. How to create an Entity-Relationship Diagram
As explained in a previous section, ERDs are the first step to start modeling as you define all your elements and relations between all the elements before you implement it technically. They help you visualize the relationships between your tables and views, as well as the dependencies between them.
To create these diagrams in SAP Data Warehouse Cloud you should follow these steps:
Go to the Data Builder and select your Space.

In the Data Builder, select New Entity-Relationship Model.
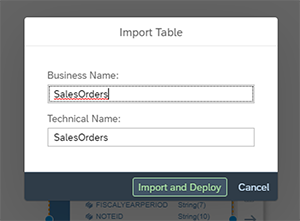
Using your Sources, drag and drop the different tables onto the canvas. When you drag each table, you’ll be prompted to Import and Deploy each table onto the canvas. Make sure to click Yes to add the table to the canvas.
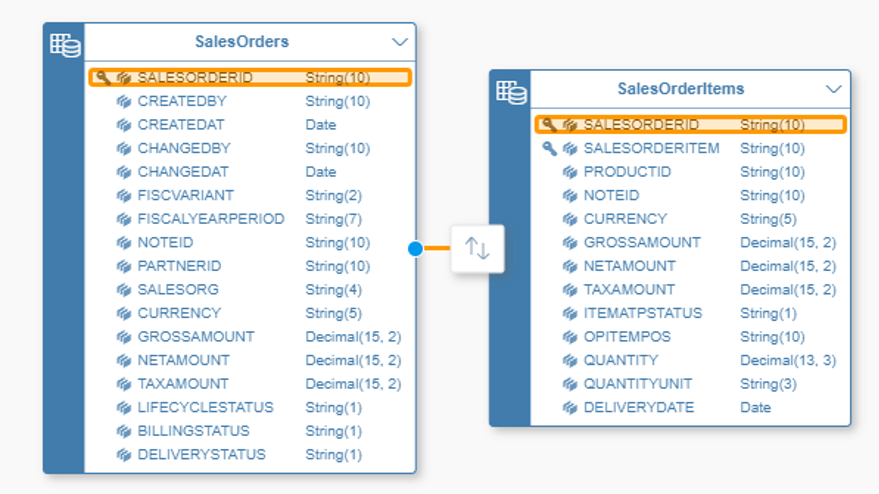
By clicking and dragging the arrow icon onto the logically associated table, you establish a relationship between those two tables in a specific direction. For example, you could connect the table Products to an additional Product Category list, which adds relevant information to the Product table.
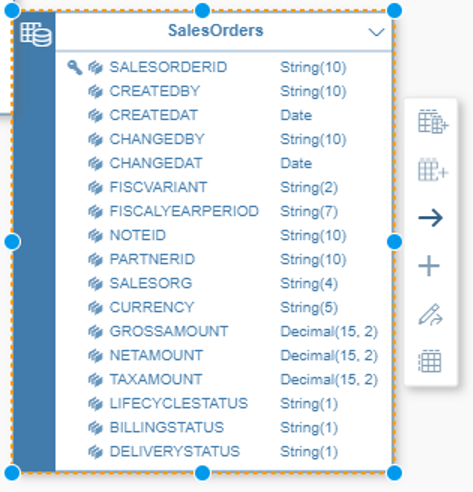
You can see which columns are joined by checking out the yellow highlights shown when you click on the join arrow between two tables.
You can now repeat this process for all the tables you wish to include in your ER model. When you’re finished, give your ER Model a Business Name, and change any technical names within the tables to business names that might be clearer. Then click on the Save icon.
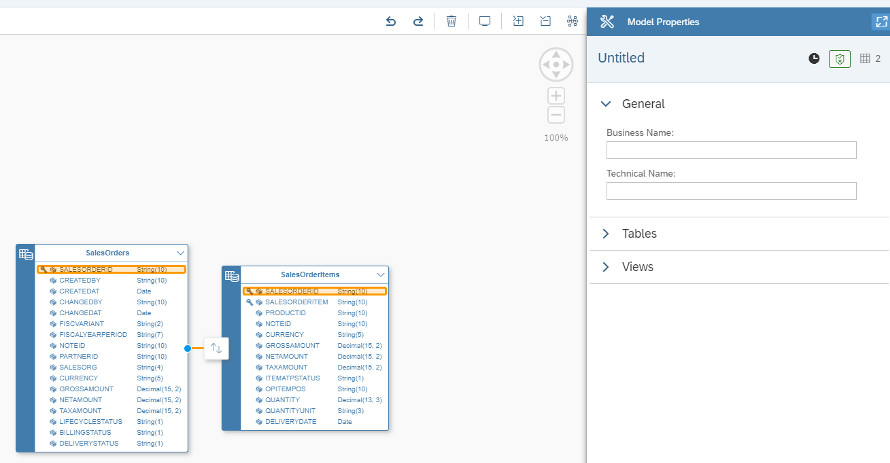
You will then be able to see the newly created ER Model in the list of available tables and views in your Data Builder. There are many applications for an ER model, but one that is specific to SAP Data Warehouse Cloud is to enable the Join Recommendation feature within the Data Builder. Once you have your ER model available within your Space, whenever you want to create a Graphical View, you can take advantage of the recommendations of which tables should be joined to the table you dragged to the canvas.
Summary
Having read this blog post, and followed the examples given above, you should be ready to start modeling directly in SAP Data Warehouse Cloud and applying the basic concepts that are explained here.
For more detailed information on elements such as hierarchies and SQL editors we recommend you dig deeper into the product manuals or the learning journeys available online. If you have specific queries about implementing SAP Data Warehouse Cloud as your enterprise data warehouse, please get in touch with us directly.
Our next article will focus on creating analytical stories in SAP Data Warehouse Cloud - so remember to keep an eye on our blog!