""

Tuning SAP Rapid Marts XI: Streamline delta loads

You have finished you standard implementation of SAP Rapid Marts XI, everything went fine but your customer start to have issues regarding the time consumption of the delta loads. In this article I will explain a couple of approaches to achieve a better performance on delta loads of SAP Rapid Marts. In the image below we have the typical infrastructure of SAP Rapid Marts, loading into on single data warehouse.

This infrastructure has pros and cons but I will highlight two main advantages:

  • Avoids duplication of information
  • Simplifies maintenance from customer perspective


1st Approach: One job runs it all

Taking the architecture illustrated above as our basis, the first step to achieve better performance will be to create one single ETL job to run the different SAP Rapid Marts involved in our implementation.

This task is simple; just create one workflow per SAP Rapid Mart containing all the different workflows that are part of each SAP Rapid Mart. Once this task is done, create an ETL job with all the corresponding global variables, drag and drop all the workflows and connect them to create a sequence of execution.

This job also allows us to take advantage of the “execute only once” option in SAP Data Services. This option is set for all the components in SAP Rapid Marts and it defines that each component within the same ETL job execution is executed only once. If you take into account how many components are shared between different SAP Rapid Marts this approach becomes very interesting.

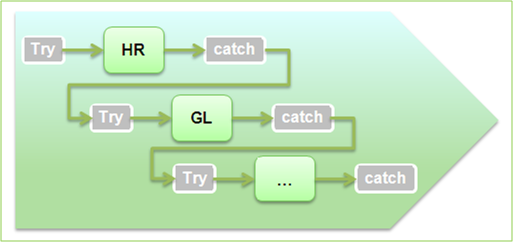
In addition, this approach allows us to create a strategy of try/catch in the ETL process. Some customer environments can have intermittent issues that can crash the execution of our daily loads (i.e. network errors). We will place try and catch statements for every workflow of the job, then inside the catch statement we will place again the workflow that we were trying to execute, the following image illustrates the idea:

The try/catch + ”Execute only once” strategy allows you to retry the execution of a component of the ETL job and continue the execution where it stopped. 

Once this idea is implemented the execution of your SAP Rapid Marts will be more robust and optimized but maybe not enough to fulfill your customer´s expectations… so let us move on to the second step.


2nd Approach: Working around a parallel execution

Analyzing the information of the Performance Reports generated in SAP Data Services Management Console after the execution of a job, you will be able to identify the components with the worst execution times.

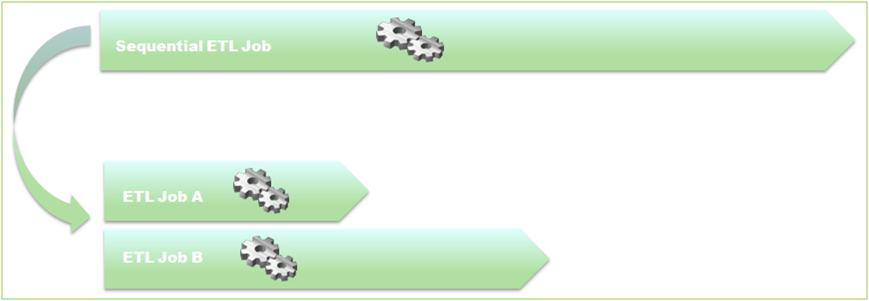
These components can vary from one implementation to another depending of your customer´s environment; within the top 10 worst execution times you will find some components generating information of dimensions and/or fact tables of the model. Some of these components can be easily removed from your sequential execution and placed on a separated job to be executed in parallel.

It is critical at this stage to ensure that these components are completely removed from the sequential execution and that any final output of the component is not used in other parts of the ETL process (i.e. subsequent table lookups). To ensure this, the function “Where is used” of the SAP Data Services Designer will be extremely helpful.

In my experience, after applying these two steps we should experience a considerable improvement on execution performance of delta loads. To give you an example, in one of our recent implementations we started with an execution time of 17 hours for five SAP Rapid Marts running sequentially, this was decreased to 6 hours using the two approaches I have described in this post.


Digging deeper

If even after applying the previous steps you still face bad performance in isolated components, this situation will require more analysis and customization at lower level.

Some components of the standard SAP Rapid Mart tries to execute on the ERP side some components with complex logic, which can take a very long time (i.e. SAP General Ledger RM + SAP Note 1557975 or SAP Inventory RM + SAP Note 1528553)

In these cases, the workaround is to split the process in several steps and maybe make use of custom tables on the ERP side and performance boost will be remarkable. I can tell you that in our most recent implementation one of the components was taking no less than 12 hours to run but after we analyzed and modified the behavior of the component, to make use of one custom table on the ERP, this component took no more than 30 minutes to run. This process of customization of a component took 2 man days to be completely implemented.

As conclusion, my experience with the SAP Rapid Marts is very positive. SAP provides a rapid deployment solution that can be up and running end-to-end in a few weeks. Furthermore, it provides an extremely easy to use framework to ensure your customer has the ability to develop any level of customization in a few weeks. Overall we are in front of a solution that will allow your customers to create their own data warehouse in weeks instead of months. If we can improve this issue of delta load performance, the solution becomes even more appealing to your customers and it helps to increase satisfaction levels with the tool.

That´s all folks! I hope this article will help you to raise the bar in your SAP Rapid Marts implementations. If you have any doubts feel free to leave a comment below.

Problems Uninstalling Data Services

I have faced a problem recently and I wanted to share the resolution, in case you have to deal with the same topic. I was trying to upgrade a Data Services machine following SAP procedure (this is copying the configuration files uninstall and then install the new version – not very sophisticated as you can see). This wasn´t as simple as I first though.

Problem started after uninstalling the software, the new version refused to install stating that I should first uninstall the previous version. I uninstalled the software again… but Data Services is still there, so uninstalled again, but this time the process failed (makes sense as the software is already uninstalled), so I kept trying… reboot…uninstall… reboot…rename older path name… reboot…you see where this is going…

So, how did I finally solve this?

  1. Start Registry Editor (type regedit in a command window or in the Execute dialog).
  2. Take a backup of the current Registry content. To do this, with the top node of the registry (Computer) selected go to File -> Export and select a name for the backup file.
  3. Delete the Key HKEY_LOCAL_MACHINESOFTWAREBusiness ObjectsSuite 12.0EIM (Suite XX.X may vary).  NOTE: You may want to write down the key KEY_LOCAL_MACHINESOFTWAREBusiness ObjectsSuite 12.0EIMKeycode first as it contains the license code.
  4. Go to HKEY_LOCAL_MACHINESOFTWAREMicrosoftWindows CurrentVersionUninstall and look for a KEY which property DisplayName is "BusinessObjects Data Services". This step is to remove the entry for the software in the Uninstall Window’s dialog.
  5. Finally delete the content of the installation directory (typically: C:Program FilesBusiness ObjectsBusiness Objects Data Services)

Now you can launch the installer and this time it should work.

Hope this may help you if in case you are experiencing the same issue. Leave comments below if you have any doubts or if you would like to add anything.


Tip of the day - Table and index size in Oracle

Ever wanted to find out how big are the tables in your data warehouse or in your ETL storage area? Here is a quick tip.

You can get the size of each table belonging to a specific user with the following code:

select sum(bytes)/1048576 Size_MB, segment_name Table_name
from user_extents
where segment_name in (
     select table_name from all_tables
     where owner = 'OWNER_NAME_HERE')
group by segment_name
order by 1 desc;

In order to get the size of the indexes with the corresponding table names (useful when the indexes have system-generated names), we need another query:

select sum(u.bytes)/1048576 Size_MB, u.segment_name index_name, i.table_name
from user_extents u
join all_ind_columns i
     on u.segment_name = i.index_name
     and i.column_position = 1
where i.index_owner = 'OWNER_NAME_HERE'
group by u.segment_name, i.table_name
order by 1 desc;
If you have any doubts or suggestions, leave a comment below.

Export to Text automation in Web Intelligence

Users typically need their Web Intelligence (WebI) data tables exported automatically into text files in order to use them across other SAP BusinessObjects BI modules. Unfortunately SAP BusinessObjects, including the newest SAP BI 4 release, does not include a direct option to automate the export of content of a WebI document tab to text format. In order to cover this gap and achieve the Export to Text feature for WebI we designed a fully automated process which is shown in this article.

The problem

Users want to automatically export raw data tables from WebI to TXT file, but none of the existing scheduling format options – PDF, XLS, CSV – are satisfying, because:

  • A PDF brings an static document that cannot be re-used directly
  • An XLS or XLSX has the limitation of 65535 or 1 million rows respectively
  • CSV does not export tables, it just exports the Query content

Users of old releases could use the old Desktop Intelligence (DeskI) module as an alternative, but unfortunately it has been discontinued in the new SAP BusinessObjects BI4 release.

The consequences

Users see WebI as an “limited” module in terms of sharing options and export size. Moreover, customers will not migrate to the new SAP BI4, especially those who heavily do Query & Analysis an export the result table to txt using DeskI. The future does not look very promising because:

  • Even if a manual Export to TXT is available since SAP BI4 FP3, automation for it is not currently available and SAP does not have a release date for this feature
  • DeskI alternative is not possible in SAP BI4. Even if a DeskI add-on is planned for coming versions, the future of its scheduling function is uncertain and corporations should not allow DeskI to be part of their BI Roadmap.

The solution

The following method describes a way to schedule a WebI report with Export to text functionality and it involves the use of the following items:

  1. A 1st WebI document with the table to be exported
  2. A Web Service that is pointing to that document table as a source
  3. A 2nd WebI document with just one query that sits on the Web Service created. No tables nor charts are needed here
  4. A vbs script that adapts the output from this 2nd WebI document

Detailed steps to follow for every item are:

  1. The 1st webI document contains all the development needed (Queries, objects, variables, filters) and a table with the final data you would like to export
  2. This 1st WebI document must be edited with WebI Rich Client. Select the table you want to export -> Right Click -> Publish Block -> Create Web Service
  3. The 2nd WebI document which contains the Web Service based query can be scheduled to run with the following options:
    • CSV type
    • Double quote text qualifier, tab column delimiter
    • Export to a server folder (e.g. D:)
    • Name it with txt extension (e.g. Results1.txt)

See below a snapshot with the schedule configuration detail:

Configuration of the schedule in WebI for a txt export

This example is applied to only 1 table to export, but multiple tables per document could be exported by ticking the “Generate separate CSV per Data Provider” option.

Once run with Success, the result of this schedule will be a text file (Results1.txt) with the content delimited by tabs but with a small defect: the so-called text qualifier (double quotes) appears everywhere.

In order to remove this annoying text qualifier (double quotes) a program can be scheduled. You can use your free style but if you copy and paste the following txt into a file called “QuoteRemoval.vbs” it will do the job:

set objRe = new RegExp

objRE.Pattern = """"

objRE.Global  = True

strFileName = "D:Results1.txt"

set objFS = CreateObject("Scripting.FileSystemObject")

set objTS = objFS.OpenTextFile(strFileName)

strFileContents = objTS.ReadAll

objTS.Close

strNewContents = objRE.replace(strFileContents,"")

set objWS = objFS.CreateTextFile("D:Results2.txt")

objWS.Write StrNewContents

objWS.close

The result of this executed script will be a perfectly formatted Results2.txt file

Last but not the least, you can build a system of events that triggers the different items sequentially, or embed these items in an object package that can be scheduled as a whole.

Applicability & Benefits

This method enhances the sharing options for the SAP BusinessObjects platform, allowing an unlimited amount of raw data to exit the platform through WebI automatically, and be re-used in Big Data modules like HANA, Visual Intelligence, Explorer or simply for individual consumption.

Seeing even further, this turns WebI into a real ETL (Extraction, Transformation and Load) tool providing integration capabilities to the end users.

Summarizing, this method:

  • Allows a better integration of SAP BusinessObjects with the corporate BI processes improving efficiency and effectiveness
  • Facilitates companies to opt for a migration to SAP BI4 release, with all the benefits that the newest platform brings

If you have questions about this method, or if you want to share your experience or tips, please feel free to leave a comment.

BI and Social Media – A Powerful Combination (Part 3: Sentiment Analysis)

In previous posts we have covered the role thatGoogle Analytics and Facebookplay in BI projects focused on Social Media Analysis. Therefore, it was only a matter of time before we covered Twitter - the most popular micro-blogging network you can find on the web. Besides that, it will not be rare to find analysts and reviews that consider Twitter the social network that can potentially deliver the highest amount of meaningful information to analyze.At this point, I guess everyone has a general idea of what Twitter is and what it delivers, so the objective of this article will be to make an overview of a Sentiment Analysis showcase that we built extracting data from Twitter with SAP BusinessObjects Tools. Then, in future articles we will cover each phase of the development in more detail. Generally speaking, we consider Sentiment Analysis as the process of identifying, extracting and measuring data from a subjective information source, such as customer surveys, opinion polls, or tweets as in our case.

Data Extraction

As in any BI project, the first step is to define the data that you need, and how to get it. Using SAP BusinessObjects tools, the best way to do this is to develop an Adapter for Data Integrator using the SDK that this tool includes in its installation folders (check this article from SAP SDN that proved to be very helpful).

However, to do the demo as quickly as possible, we used another approach:

  • We developed a Java program that made use of Twitter’s getSearch API to extract tweets and place them in text files Note that for demo purposes this is more than enough, but for a broader project the flat files are not a satisfactory solution.

  • With Data Integrator, we configured an ETL flow to extract the data from the files and store them in database tables to accumulate enough tweets to make the demo meaningful.

Also consider that in this phase it is very important to get comfortable with Twitter’s API and the different parameters that it uses so you can take advantage of it as much as possible.

Data Parsing and Sentiment Analysis

Once we were able to place the tweets in text files and customize the extraction parameters as we desire, then we could actually analyse the tweets to start delivering insight from them. To do so, we followed these steps:

  • Get the raw tweets that we stored in the database before and perform a parsing process with Data Integrator, to get rid of the JSON format that Twitter API uses, enabling us to manipulate the tweets as text strings.

  • Use the feature of Text Analysis that Data Integrator includes to perform the “Sentiment Analysis” process and classify the tweets in one of the different sentiment categories that we used. For the demo purposes that we had there is a SAP Blueprint called Text Data Processing Data Quality that contains Data Integrator jobs with a Voice of Customer implementation that already contains a set of extraction rules implemented for the English language. Therefore, you can make use of this blueprint and its rules to develop the Sentiment Analysis phase.

  • Build a universe on top of the tables with the analyzed data in order to make it available for reporting with any of the SAP BusinessObjects tools that take an universe as data source, e.g. Xcelsius, WebIntelligence, Explorer, etc. In this step, we also made a use of an universe that came included in the same Text Data Processing Data Quality blueprint that we used for the point above.

Data Visualization

Finally comes the eye-catching part: present all the hard work you have done. To show the users how flexible this solution can be, we decided to present the data with Explorer and some Exploration Views built on top of its Information Spaces. However, as said before, if you build an universe on top of the tables that resulted from the Text Analysis process then you will have a great number of possibilities and tools to play with, in order to bring forth the presentation you want according to your requirements and objectives.

In future articles, we will cover each one of these sections in further detail. However, with this general layout we hope you get a good idea of what you need to do to make your Sentiment Analysis demo happen!

If you have any questions or anything to add to help improve this post, please feel free to leave your comments.

Turn data into actionable insight with BI

Making Better Data-Driven Decisions

Do you wish you had a clearer view on the performance of your company and feel you lack key information to guide your decisions? All the Data you gather in different departments is just piling up, isolated and useless? Taking your organization through the current fragile economy is already challenging enough to do it without visibility of what happens in your organization. In order to solve issues and take advantage of strengths you need to turn data into actionable insight. SAP business intelligence software solutions give you the visibility you need to make important business decisions based on key data and facts, not guess-work. They allow you to draw information from data, rather than just storing it for the sake of it.

Interactive dashboards and rich visualizations help you monitor your business performance at a glance, and the real-time insights allow you to adjust aspects of your business before they become a real problem.

Reporting allows you to access and transform corporate data into highly formatted and automatic reports, while interactive reports let you answer ad hoc questions and interact with data, building your own queries.

Analysis solutions help you determine trends from historical data and make better forecasts.

With data explorations tools you can find immediate answers to business questions in a search-engine manner.

With BI application design tools, your IT department will be able to create BI applications for specific audiences.

It´s not necessarily a matter of implementing each and everyone of the solutions. Depending on your particular needs and user types, you could select the more adequate tool. Take a look at the SAP Business Intelligence Solutions Comparison Matrix to understand a bit more about each product.

Take the example of Vodafone Turkey, they used Excel to manage their several marketing campaigns in the past, but this process was not only susceptible to human error, but also time-consuming. They needed a functional solution to serve multiple users and help them understand campaigns and act according to their results.

They implemented a central dashboard, a highly visual solution that could accommodate a large number of campaigns and variety of KPIs for both new and recurring campaigns. The Campaign Analytics Solution allows the team to analyze existing campaigns and design outlines for new ones based on key success factors. The dashboard also helps the team to understand the net take rate for each campaign compared to the targeted subscribers. And more significantly, marketers can now easily and definitively follow the revenue generated by each campaign.

If you wish to know how SAP Business Intelligence Solutions can help solve your company´s specific needs, contact us on info@clariba.com or leave a comment below.

Data Quality - the basis for good BI

Usually companies learn about the importance of data quality management in the worst possible way – by dealing with the issues generated by the lack of it, and addressing data errors, data movement, and unstructured data after many costly problems. If your data is lacking in quality, everything you learn from it is useless, as information cannot be trusted. Without accurate customer and performance insight you will never be able to see what areas of your business need to improve. Data Quality Management solutions allow you to integrate, transform, improve and deliver trusted data that supports critical business processes and enables sound decisions. As you expand into new markets or develop new products this will become even more important, as the more data you gather, the easier it is for problems to start occurring.

With SAP Data Services you can enjoy a single solution that encompasses data integration, data quality, data profiling, and text analysis. This will allow you to deliver trusted data that supports critical business processes and enables sound decisions.

To give you an example of the importance of data management, Vodafone Netherlands sought the help of Clariba to implement key reports within a maintainable BI solution while automating report generation and distribution and also to develop a dashboard with key indicators for management. However, the first phase of this project focused on ensuring that trusted data was provided from the current databases to the BI solution. Complex queries were streamlined and redundant data sources consolidated. Subsequently BusinessObjects universes were developed for the central data warehouse and the CDR data mart. Only when the relevant data sources were available, with good quality data, the Clariba team went on to develop the reports and dashboard.

Learn how SAP Analytics Solutions can help your company with its data quality management, making quality your goal. Contact us on info@clariba.com or leave a comment below.

Successful Change with SAP Business Intelligence

Deliveting Business Transformation

The pace of change, specially due to the rapid deployment of new technology is growing at an incredible pace. For businesses to remain competitive, they need to keep up with these changes almost constantly, it can come from an expansion, restructuring, merger and acquisition, regulatory compliance and more.SAP Business Intelligence Solutions unveils key concepts and processes that are vital to the planning and execution of successful change strategies.  Being aware of happens in your business can optimize organizational change and smooth and speed the transition periods.

Take the example of Doha Bank, when they had to adapt to a new mandate from the Central Bank of Qatar to report key balance-sheet figures on a monthly basis. The timeline was tight and the requirements complex, with the pressure of punitive fines for the non-compliant.

The internal financial reporting was previously done manually, and data required for the monthly reports was spread across several sources. After an intensive process of data cleansing and consolidation, the Bank went for a SAP Business Intelligence solution called Web Intelligence, which allowed for the reports to be produced automatically, in a timely and error-free manner.

Although we used the example of a big organization, these solutions can also be adopted by the SME. SMEs use their speed of action as competitive advantage to remain in the game with the big players, and they have to constantly adapt to change, be it in the market, in their organization or in their business model.

Find out how your SAP Business Intelligence Solutions can deliver business transformation. Contact us on info@clariba.com, o leave a comment below.

Do you know what drives your business?

Knowing your business and making smarter decision in order to keep up with the everyday risks involved in running your business is critical in order to survive in today’s global economy. Making effective decisions requires information. This information must be accurate and updated, and in the right level of detail that you need to be able to move forward at optimal speed. Key business analytics is what allows you to draw information from the data you collect in the different parts of your business. When you understand exactly what is driving your business, where new opportunities come from, and where mistakes were made, you can be proactive to maximize existing revenues and reveal areas for expansion. Better decisions can be made when you have more visibility into vital insight coming from your own company.

SAP Business Intelligence (BI) Solutions provides a window into your company. A dashboard for example is a single, reliable, and real-time overview of your company.  It offers you quick insight, in visual appealing formats that are easy to understand. You also have "What-If" tests that let you measure the business impact of a particular change. This can also be made available on mobile devices, so you can make informed decisions on-the-move. When you have information you can trust, you are able to act rapidly and stay ahead of the game.

With years of expertise in BI, Clariba has helped several companies to draw insight from their data. For example, Vodafone Turkey´s Marketing department sought our help to provide the Customer Value Management Team with a dynamic and user-friendly visualization and analysis tool for marketing campaigns. With the central dashboard we delivered, the marketing team was able to analyze existing campaigns and design outlines for new ones based on key success factors.

You can learn more about SAP BI solutions here, and you can also watch SAP BI Solutions videos on YouTube. Want to unlock this information on what drives your business forward? Contact us on info@clariba or leave a comment below, and discover how SAP BI Solutions can help you achieve it.


Boost Business Performance at SAPPHIRE NOW

Your business is a living thing, made up of interdependent systems that must work together to carry out crucial processes. Its an arrangement of moving components that operate and interact to deliver results.  Therefore it is vital that all the departments functions flawlessly so that your business can grow.

For this to work out, the first step is to have the right technologies in place to automate repetitive business processes, reduce human error, support communication and collaboration, and monitor performance.

Benefits can be felt in all hierarchy levels.  Top level executives will be able to examine the overall health and direction of the company. Department leaders such as the CFO will e able to tap into analytics and performance management tools in order to get visibility into performance, support compliance and reduce risk. HR can streamline the administration tasks and focus on aligning talent to business goals. Sales and Marketing can understand what customers want and deliver products and promotions accordingly. Operations can be optimized by improving planning and stock replenishment to function more profitably.

Do you want to know more about what SAP solutions could do for your company? If you are at SAPPHIRE NOW don´t miss the opportunity to network with your peers in similar industries and find out how they've used SAP solutions to solve common business challenges in this last day of the event. Visit the interactive campus to get to know all the latest innovations from across the SAP portfolio. Learn more about top solutions from SAP HANA and see why this is the fastest growing product in SAP, business analytics, mobile solutions, the cloud, to database and technology.

If you don´t have the chance to be at SAPPHIRE NOW Madrid this year, contact us at info@clariba.com and we will be more than happy to go through the latest SAP innovations with you, ans share some of our successes, for example on the SAP HANA proof of concept we are developing for a major Telco player in MENA, or the implementation of a BI mobility solutions called MyBI Mobile, which enables you to bring all your SAP Business Intelligence content to mobile devices (including Xcelsius on iPad). You can also visit the SAPPHIRE NOW LIVE website to watch live presentations and panels happening on this last day of SAPPHIRE NOW, and also view the replays of what happened on the previous days.