By this point in our series, you should be familiar with the basics of data preparation and you should have learned how to expose data from your source system for end-user consumption.
In this article, we will explain how to create analytical stories in SAP Data Warehouse Cloud with the use of the embedded SAP Analytics Cloud.
1. Stories in SAP Data Warehouse Cloud
Using SAP Data Warehouse Cloud together with the SAP Analytics Cloud, you are able to create data models merging different source systems along with analytical stories to provide easily understandable insights to business users, all in the same location.
2. Design Guidelines
Before we begin, let’s take a moment to review some key design guidelines that will help you to build your story in a way that makes it easy for even non-technically minded users to parse and understand the information presented.
Define Your Goals
First off, you should clearly define the business questions you are aiming to answer in your story.
Use Design Principles
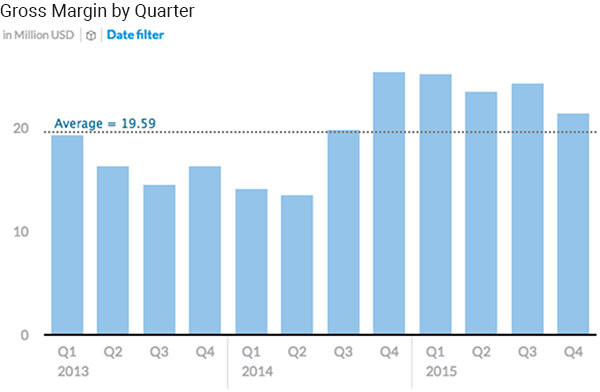
Stick to a clean, clear design - don’t overuse colors or crowd too much information into one space.
For example, both charts shown below are communicating the same information, but it’s much easier to see which quarters show the best performance in the second example where the design has been simplified.

Use Numeric Points for Immediate Impact
In the example below, putting the Numeric Points on the left-hand side is a good idea, as most people will read the Story from left to right. The reader’s attention is drawn first to the number of contractors, total billable hours, and amount spent.

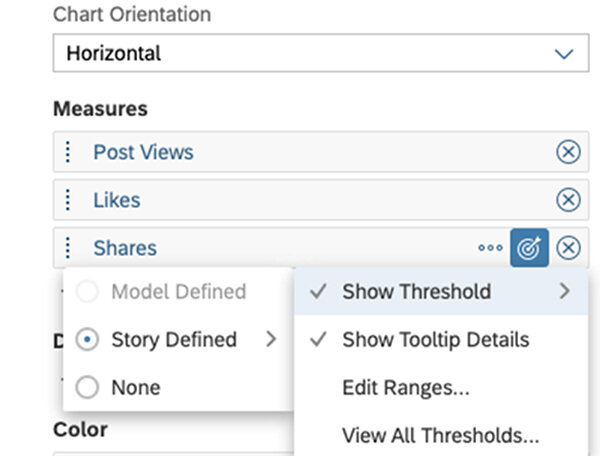
Add Thresholds
Adding thresholds will help business users to monitor the performance of each KPI and understand which are the areas that they need to focus on.

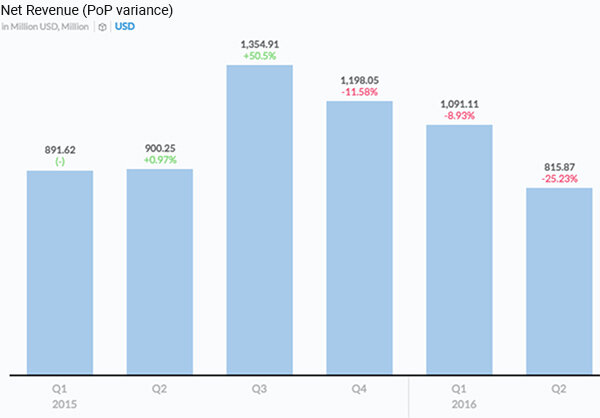
Use Variance for Context
In the same way as thresholds, adding variance comparisons will help users to understand, at a glance, if the data shows a positive or negative trend.
To apply variance to your chart, click on it then hit Add Variance. You can then choose to view the difference in values as a percentage, a numeric value, data labels on an existing chart, or a bar chart within the chart widget.
Add Linked Analysis
Linked analysis creates a harmonic atmosphere where you can select which charts and elements are connected and set them to be filtered accordingly and in sync with one another.
To add linked analysis, click on a chart and select Linked Analysis. Choose whether to apply the analysis to selected widgets only, all the widgets on a page, or all the widgets in a story and click Apply to commit the change.

Use Filters (Input Controls)
You can add input controls to filter data based on certain dimensions or facts according to your needs. Input controls can either be applied to your entire story or just to certain charts or pages. This allows users to view data for only the specific variables selected at that moment. To create an input control, select Insert > Input Control from the main toolbar, then choose the dimension or measure you would like to filter by. In the example image below, an input control is added to filter quantity sold per sales manager, by location.

Try these tips the next time you build a Story in SAP Data Warehouse Cloud to get the most out of your data and make life easier for business users.
3. Creating your Story
After following the previous articles in this series, you should already have your model connected to SAP Data Warehouse Cloud. Here we will explain how to create your analytical story directly in DWC.
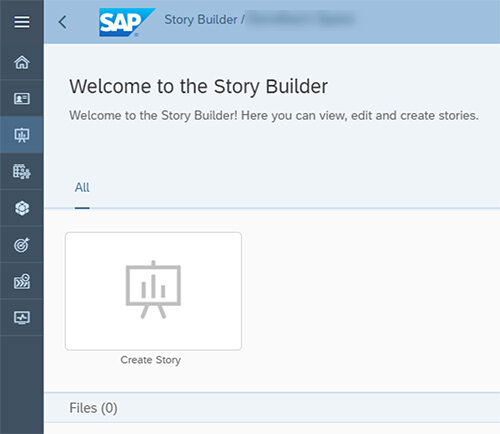
Go to the Story Builder icon.

Then, select the Space in which you want to build the story. You can only create a story related to one specific Space.
After choosing the right Space, click on the Create Story button.

The next step is to select the data output that you modeled in the Data Builder, which you can do from the drop-down list on the pop-up you’ll see on the screen. You can either click on an item on the drop-down list or type a search term to find your data set.
Once your data source is selected, you need to choose how you want to visualize it. For this example, we want to share our findings by using a chart.
Click on Chart.
Once you choose the type of visualization you wish to use, you will see a series of options on the right side of your screen, in the Builder pane. First, click on the specific parts of your data you want to show and highlight.
After this step is complete, you will see a series of options that allow you to customize the design of your visualization. You can find these options in the same place as the Builder pane, which now is called Styling.
At this point you can choose either to insert additional elements, such as a table, a text box, or even a live RSS feed, bringing dynamic information into your visualization.
To add more elements, click on the Add button under Insert.

Alternatively, you can also take advantage of one of the suggested layout templates before you start so that your final story is already designed for you and ready to be shared.
To use the layouts, click on the Layouts button under Format.

Once you are happy with your story, you should save it. You can either click on the Save button under File or choose one of the options on the menu right next to it. Save As allows you to save the same report with a different name. Save As Template allows you to create a Story template based on this story.

You also have the option to export your story either as a PDF or as Google Slides, if that option is enabled by your system administrator.

That’s all you need to create a visually compelling story with the SAP Analytics Cloud directly within the SAP Data Warehouse Cloud. Having followed the instructions and examples given above, you should be confident and comfortable creating your own stories.
If you’re interested in learning more about setting up SAP Data Warehouse Cloud as your enterprise data warehouse, please contact one of our team, and we’ll be happy to talk through the process with you.
In our next article, we’ll be taking a detailed look at how to connect SAP Data Services to SAP Data Warehouse Cloud - stay tuned for the next installment!
References
https://saphanajourney.com/data-warehouse-cloud/learning-track/data-stories/
https://saphanajourney.com/data-warehouse-cloud/learning-article/building-stories-with-impact/
Unboxing SAP Data Warehouse Cloud – Part 1
Unboxing SAP Data Warehouse Cloud – Part 2