Custom R Components – Weight of Evidence coding and scorecard builder application
Introduction
This application provides an analysis of exploratory type, used to determine which variables in the dataset have a predictive power over the dependent variable (target).
It has been a very popular method in scorecard development – for credit risk within the banking sector, but in the recent years it has received increased attention in other sectors, as well.

Prerequisites
We suggest installing the RStudio Integrated Development Environment (IDE), as it is the most popular interface for R.
You can, then, simply install the following libraries through RStudio:
data.table (available on cran)
To install the package use the following command: install.packages(“data.table”)
devtools (available on cran)
To install the package use the following command: install.packages(“devtools”)
woe ( available on Github)
To install the package use the following command: install_github("woe","barbuirina19")
If you need assistance configuring R in SAP PA Expert Analytics, refer to the following guide.
How to upload the component in SAP PA
You can download the component as a .spar file Github and then deploy it as described here.
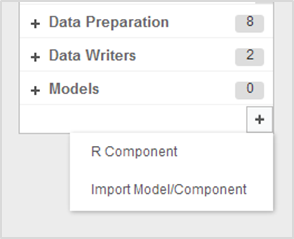
Simply import the component by clicking the + button under models tab:
Usage
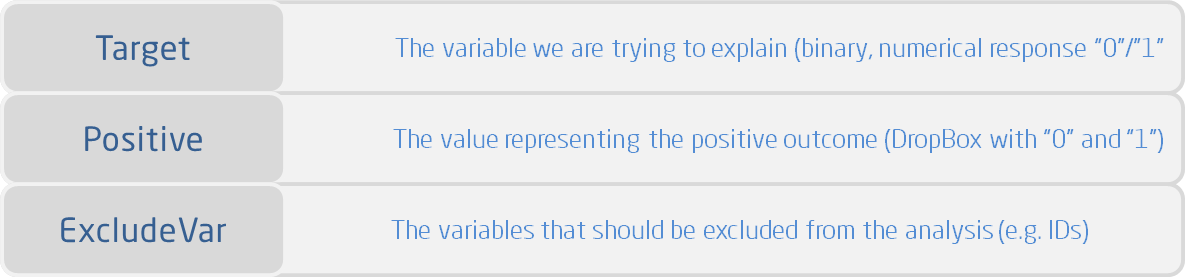
The users can set the following parameters:
Example
We can use the Insurance_training dataset, which can be found here.
This table contains data on the customers of insurance company (demographics : age, gender, children, profession and more specific: type of car, annual km, years since license, etc.)
The goal is to analyze the past accident claims and get a deeper understanding over the main characteristics of a risky client. The scorecard that gets generated can be, then, pushed into a database and used to generate risk scores for the new insurance applicants.
In the Predict tab, simply drag and drop the new component, right click on it, and Configure Settings:
After successfully running the analysis, you can explore :
1. Scorecard table
2. Variable importance chart
3. Weight of evidence charts
1. Scorecard table
2. Variable importance chart
3. Weight of evidence charts
Please note it is mandatory that the target variable be binary and numerical. The application will not translate categorical variables into the appropriate format (e.g. “Yes/No” response variable into numerical “1/0”).
In case the target is not numerical, simply use a formula (under Data Preparation) and do the necessary changes before running the analysis.
In case the target is not binary (more than 2 values), then use a formula to create dummy variables and then run the analysis using each one of the new variables as target.