A few months ago a client asked me about how to be aware about problems (disconnections) in the different servers and services of their SAP BO4 SP4 without needing a person to constantly check the status. I then started to research about the monitoring feature in the CMC. The truth is that there isn't too much information about it in the documentation, just some pages in the Platform Administrator Guide, or posts or references to this topic around the web. With this post, I will try to compile all this information I have found and will explain the use of these interesting features and give you a brief introduction to CMC Monitoring.
First of all, let me explain what is CMC monitoring: Monitoring is a new feature of the CMC that appears with SAP BusinessObjects 4 and allows Administrators to see the use and health of the BO system. For this, it uses watches, probes, metrics and alerts. There are some default ones, which allow the Administrator to start playing around with monitoring without a huge knowledge on the topic and obtain really useful information about the status of the system. Before using this feature we need to know the actions we must perform and the existing limitations.
Also, we must ensure the information for monitoring is stored in the Monitoring database. This is a Derby database and it works independent from the other two DBs in SAP BusinessObjects. To activate the Monitoring database we need to log into the CMC, and go to Applications, and double click on the Monitoring Application. This will open the Properties window of the Monitoring Application. Make sure that “Enable Monitoring Application” is checked. Click Save and Close. The final step is to restart the Adaptive Processing Server (APS) if it was not checked. The information in the DB is deleted every time we reach 1GB of information. We can increase that size in the CMC.
Monitoring
To reach the monitoring section in the CMC, we need to go to Applications > Monitoring
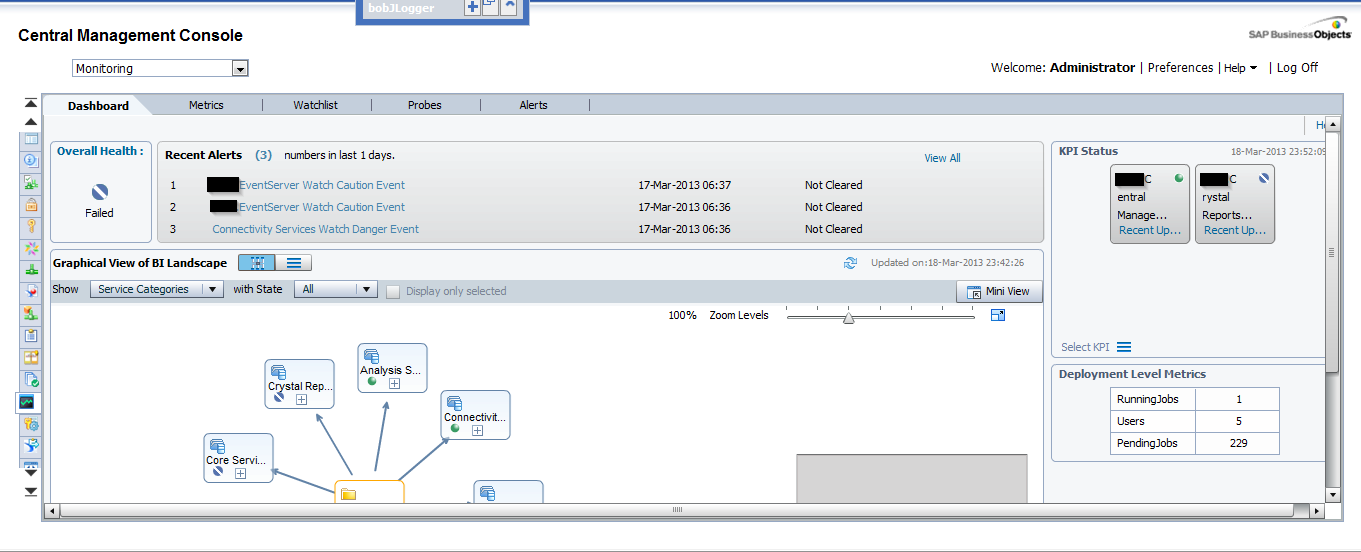
As we can see in the above image, there are 5 different tabs in this section: Dashboards, Metrics, Watchlists, Probes and Alerts. Let's run through each one:
1. Dashboards
it is the default tab and as the name says it is a dashboard which is divided in 5 parts:
- Overall Health: It is an icon showing if the BO is working correctly or not.
- Recent Alerts: Here we can see the alerts triggered the last 24 hours by the system.
- Graphical view of BI Landscape: this panel includes a graphical or tabular view of the Watches within the system .We can drill down click in them.
- KPIs Status: This part displays three Key Performance Indicators for the system. We also can drill down clicking on them.
- Deployment Level Metrics: we can see 3 interesting metrics as the running jobs, the users and pending jobs.
2. Metrics
Metrics are individual pieces of information that contribute to know the health of the different components of the system.

Metrics are used to measure the health of a component. The metrics we define will depend on the components we are monitoring and our requirements. Examples of metrics are user login time, query execution time, CPU usage percentage, availability status for a system service, etc. We can use them in Watches and Alerts, setting thresholds for Warning and Danger alerts. There are around 250 predefined metrics. Furthermore, we can create our own metrics if we think they are necessary. Normally, with the default ones, we can check the status of almost everything in the system.
If we select a metric, we can observe the historical and current status of it.
3. Watchlists
This tab lets us monitoring the watches that we have created. The watches are thresholds for metrics that show us if the metric is on a healthy, warning or in danger status.
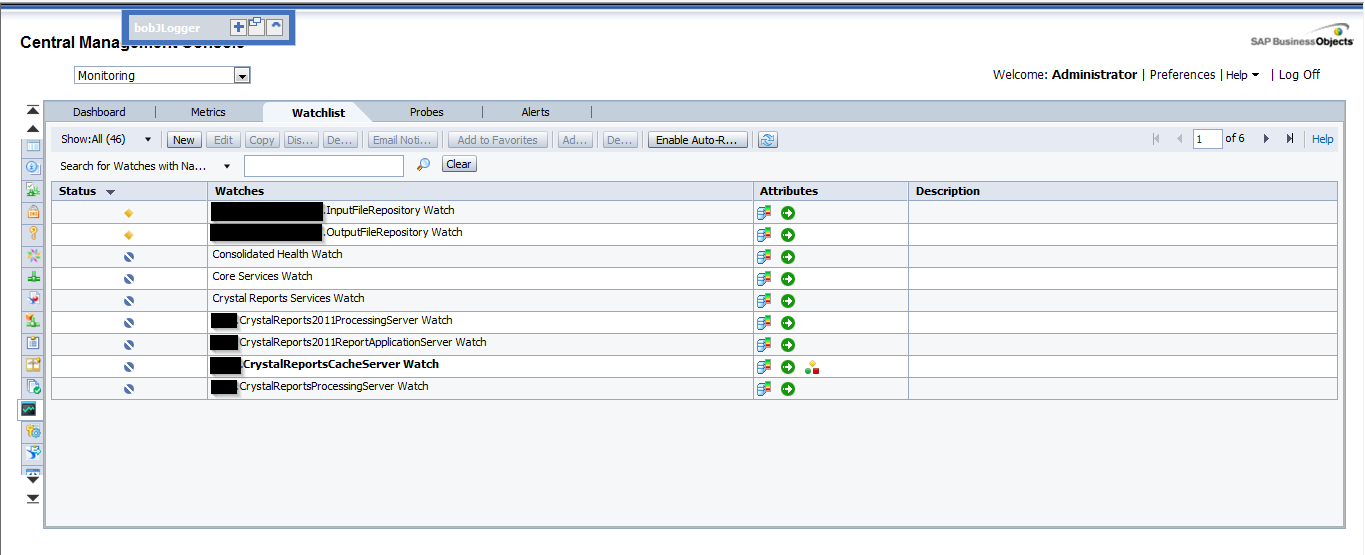
Again, we have created watches by default. We can change these thresholds to adapt them to our system. Also, we can create notifications to the watches, hence, we can ask the watch to send an email if the system is in danger, for example. There are a lot of interesting options with the watches. I encourage you to try them by yourselves.
Finally, we can decide which are the watches that we want to see in the dashboard tab.
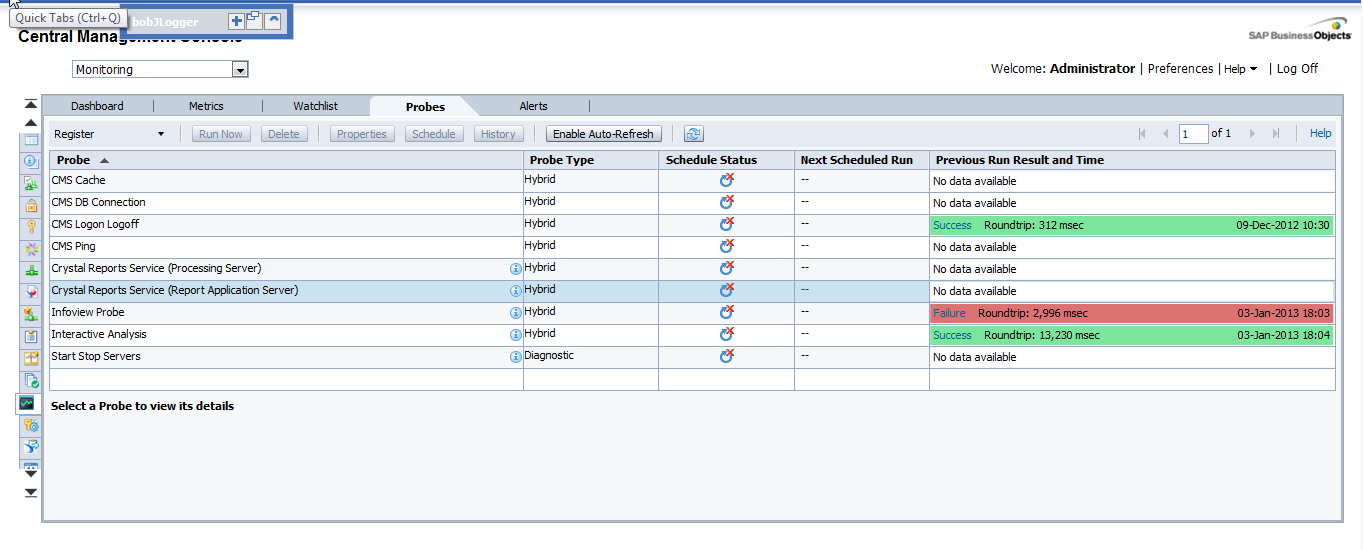
4. Probes
They provide us the ability to monitor our SAP BusinessObjects system, using simulated application work-flows which are run through SDK-based scripts.
This is the most interesting part of the CMC monitoring but, at the same time, the most difficult. As we can create probes with a SDK, the power of this tab is huge. We could create whatever we want, but it is not very easy to create these probes. There are not examples around the net or they are very difficult to find. (I will try to add another entry in this blog in the future with an example).
As I mentioned before, the system will provide default probes. We can choose among 9, which are:
- CMS Logon Logoff probe: Monitors if a user can successfully log on to the SAP BusinessObjects system and how long does it take.
- Crystal Reports service through Page and Cache Server probe: Monitors the availability and performance of the Crystal Reports service (through the page and cache servers).
- Crystal Reports service through Report Application Server probe: Monitors the availability and performance of the Crystal Reports service (through RAS).
- Infoview Probe: Monitors the availability and performance of logon/logoff the InfoView web application.
- Web Intelligence Service Monitoring probe: Tests the availability and performance of the Web Intelligence Service through the report servers.
- CMS Ping probe: Tests the core functionality of the CMS.
- CMS Cache probe: Tests the availability of the CMS cache.
- CMS Database Connection probe: Tests the connection to the CMS repository.
- Start and Stop Servers probe: Tests to start and stop the different servers of the system.
5. Alerts
Here is where all the Alerts that we have set up in the Watchlist will appear.

This is a list of the alerts that the system raises. We can see the different details of the alerts when clicking on them. These alerts also can send emails and perform actions, depending on what we have set in the watchlist.
How to use all in one
With all the above information, I have explained an overview of the different tabs of the monitoring and also what we can do with each one of them.
If we want to tap the full potential, it is easy to see that all the tabs are connected and we need to use them all. One nice example could be monitoring the response time to open a report in the system. For this, we use the probe "Web Intelligence Service Monitoring" that logs in and we try to open and refresh a report in Web Intelligence. After this, we use the metric of the time that takes to the system to execute the probe and the metric that says if the probe was successful or not. Also, we create a whatchlist with this metric and if the probes takes more than 5 seconds, it will send an email advising the Administrator that the system is working a bit slow and if the probe fails or takes more than 15 seconds, it will send another email advising that the system is not working properly. We can schedule this probe to be executed on a daily basis.
With this simple scenario we are able to detect any problems in the system automatically, before any user reports it. Moreover, the tabs' alerts will show us if there is something wrong that we had not noticed before.
Conclusion
As a conclusion, we can see that by playing around with all of these features, we can accomplish really interesting things and get most everything under control in our BO system. It could appear difficult to learn, but there are a lot of things that we can do just with the default settings. After you get used to them, it is time to play with the power of the self-created probes and add more personalized options to our monitoring.
I hope this introduction to monitoring has helped you to understand a bit more how CMC Monitoring works in SAP BO 4 SP4.
If you have any questions or suggestions, please leave a comment below.