As you may know, there are different workarounds to include dynamic maps in SAP BusinessObjects 4.1 Web Intelligence, such as using hyperlinks (i.e. Dashboards) or external API’s (i.e. Google Maps). In case that the reports have to be printed as they are, these options do not provide a solution because it’s necessary to embed an image and not a hyperlink in the document.
Our solution consists in using empty cells and insert PNG images of the regions/countries as a background.
With the following example, we explain the steps to implement a dynamic map:
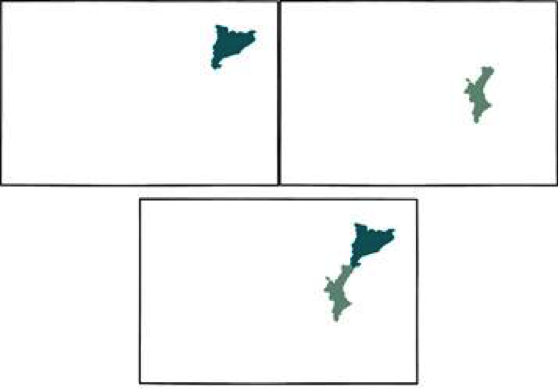
Each region changes its color automatically depending on the value. For example, if the measure is less than 100 the region will be red, if the measure is between 100 and 200 will be yellow and if the measure is bigger than 200 will be green. So we could see that in January the region was in red, but in March have turned into green.

Steps to reproduce:
We need each region to be colored with 3 different colors. In order to maintain the structure and scale of the map, it is important to use the entire image of the map and erase all the regions except the selected one. In addition, the images have to be in PNG format with a transparent background. Overlapping the images will build the map (see below).
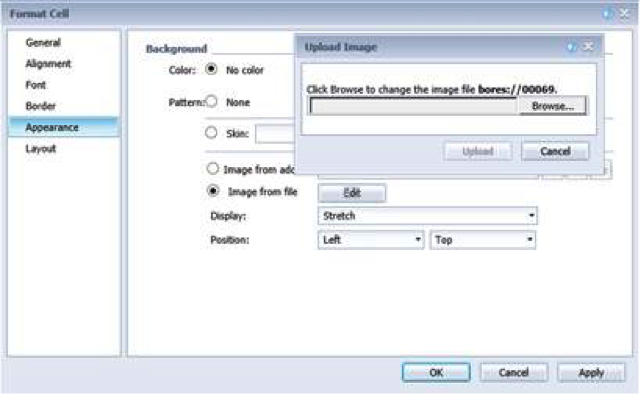
In the report, insert an empty cell and go to Format Cell -> Appearance -> Image from file -> browse and select the image. Repeat this for all the images.
Align all the cells with the same position.
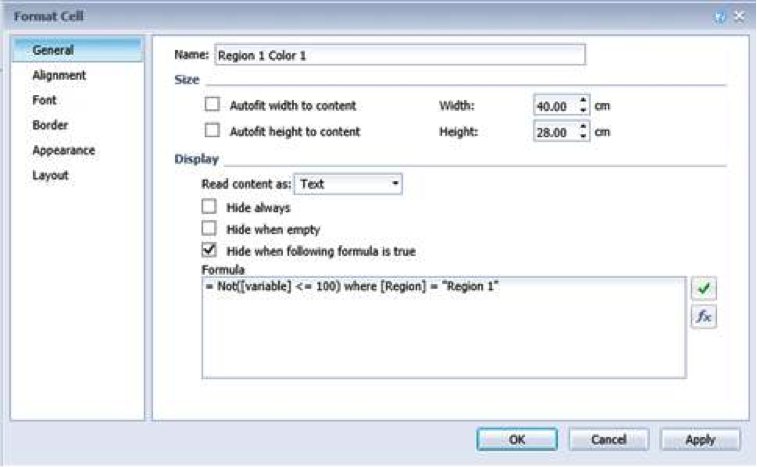
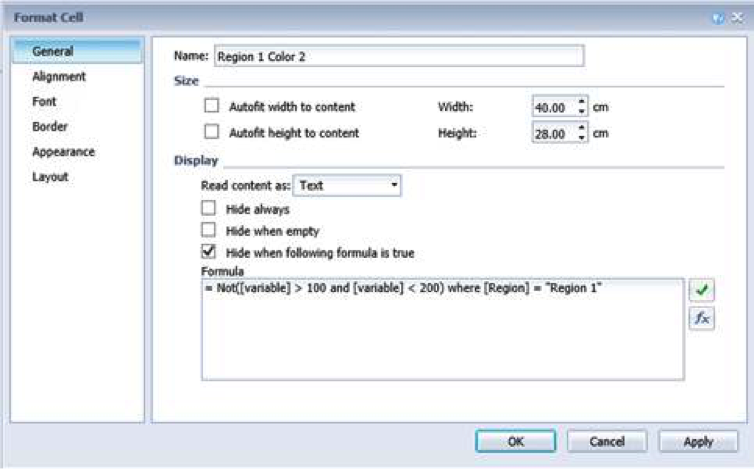
For each region, select the cells and go to General -> Display -> Mark the option “Hide when following formula is true” -> write the following formula:
color 1: “= Not([variable] <= 100)”
color 2: “= Not ([variable] > 100 and [variable] < 200)”
color 3: “= Not([variable] >= 200)”
Finish!
Now we have a map where automatically will change the color of the regions depending the value.
(Note: in old versions of the platform, there is a visual bug in the HTML viewer that changes the color images from the original format. To avoid that, install the Service Pack 6 or the 5.6 Patch)